2017issue C0518-21
Fixed-fraction sizing versus a theoretical pattern edge
A constant one-dollar bet defines a pattern’s theoretical edge. Finite equity forces a fractional bet, and frictions plus the chosen historical window shrink how much of that edge remains usable.
- Theoretical edge is the historical mean profit factor from betting a constant notional amount on every pattern instance, a scheme finite account equity cannot keep in place.
- Fractional betting allocates a fixed percent of current equity to each new opportunity and produces a realized edge that approaches theoretical edge only as that percent approaches zero.
- Percentage profit typically rises with allocation, peaks at optimal r, then further size mainly adds risk while realized edge keeps falling.
- Commissions, spreads, and slippage cannot be simulated precisely, and the historical window treated as the relevant sample can leave an interval that includes substantial losses.
A constant bet defines theoretical edge
A constant one-dollar bet on every historical instance is the theoretical baseline used to define a pattern’s edge. Finite account equity makes that scheme infeasible and forces size to fall when the account shrinks.
Theoretical edge is the historical mean profit factor implied by betting a constant notional amount on every instance of a pattern. That figure describes the pattern under an unchanging stake, not under the size a finite account can actually post.
Fractional betting changes the realized edge
Fractional betting is an anti-Martingale rule that allocates a fixed percent of current account equity to each new opportunity so a losing streak cannot drive the account to zero. A fixed-percent allocation of that kind creates a related but not necessarily equal realized edge, because the betting scheme departs from constant notional size as the account changes.
Realized edge is the edge obtained under a chosen allocation percent. As the allocation percent approaches zero, realized edge approaches the theoretical edge. Both realized edge and percentage profit are zero when the allocation percent is zero.
Percentage profit peaks at an optimal allocation
Percentage profit typically rises with allocation at first, then peaks at an optimal allocation. After that point, further size mainly adds risk while realized edge continues to decline. Optimal r is that allocation percent: the point at which percentage profit peaks, after which extra size mainly adds risk while the realized edge keeps falling.
In the supplied fractional-betting illustration, a 13.1 percent allocation produced 20.31 percent percentage profit and 8.87 percent realized edge. At most 8.87 percent of a 17.5 percent theoretical edge was fully exploitable.
Finite capital requires a bound before the next trade
Unlimited capital would allow a Martingale increase after losses to force profitability regardless of theoretical edge. Finite capital rules that path out and requires bounded exposure before each trade.
Frictions make a backtested edge look too high
Commissions, spreads, and slippage cannot be simulated precisely, so a backtested pattern edge is almost certainly higher than the edge available after real-life frictions.
A friction-conservative fill is a defensive backtest assumption that uses adverse prices and harsh commissions so the estimated edge is not overstated. Entering at the high of the entry bar, exiting at the low of the exit bar, and applying harsh commissions, or concentrating on longer-horizon manifestations, can keep friction effects from inflating the usable edge.
The sample window can erase an apparent edge
Population choice is the decision about which historical window of pattern instances is treated as the relevant sample for estimating an edge that a trader can actually use.
A 16.6 percent historical cup-pattern edge from 1982 to 2014 split into 35.8 percent for 1982 to 2000 and 1.35 percent for 2000 to 2014. The later window’s 99 percent interval of -6 percent to 9 percent includes substantial negative territory.
Cup-pattern cumulative daily profit factor, 1982–2014
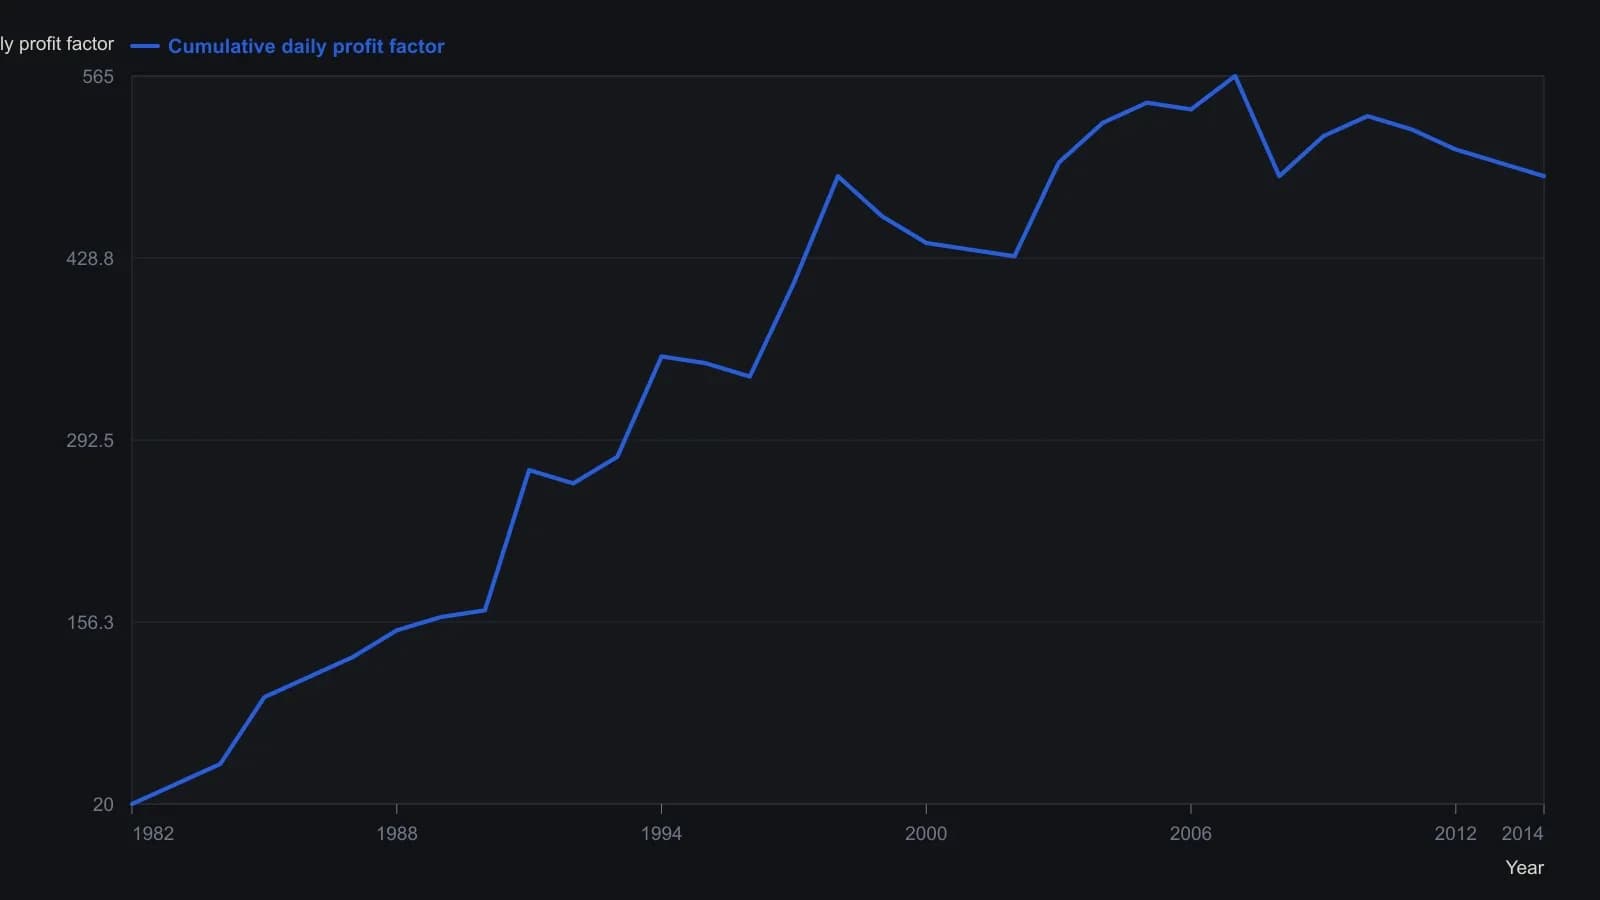
Daily PF is the sum of profit factors for cup trades that closed that day; the line is the running total of those daily sums. Readings are approximate: the dark raster supports only about five PF units of precision. Identification ran on daily S&P 500 charts (3,991 cups).
All readings on this track · 9 readings
- 1982Three gates for a futures book: equity risk, expected value, and shrinking pyramids
- 1995A Kelly-style leverage grid and reshuffled paths
- 2004Bound the loss before leverage changes size
- 2010Treat risk of ruin, drawdown limits, and Kelly sizing as consistent pre-trade filters
- 2010Fixed-fractional forex position sizing
- 2013Kelly fraction versus risk of ruin
- 2016Expected value versus leverage, drawdown, and Kelly sizing
- 2017Fixed-fraction sizing versus a theoretical pattern edge
- 2018Evaluating double-bottom breakouts as a testable system