2014issue C0810-13
Equal-dollar staging versus lump-sum and residual scaling
Editorial reading: treat equal-dollar staging as a cash-availability rule, and treat later scale-in and scale-out position rules as a separate cost-recovery size procedure. A funding schedule is not the same decision as residual-share scaling.
- Dollar-cost averaging deploys a fixed cash amount through equal scheduled purchases instead of a lump-sum purchase on one date.
- Regular paycheck contributions are a setting where staged buying is used because a lump-sum purchase is not available.
- Scale-in and scale-out position rules belong to a residual-share procedure that can recover the cash outlay and leave a zero-cost residual.
- An overlapping window test repeated the same holding-period comparison on successive start dates so one start month does not dominate the sample.
Two cash-deployment paths
A staged-buying procedure was defined as splitting a fixed cash sum into equal monthly purchases rather than placing the entire sum on one date. In the terms used here, that schedule is dollar-cost averaging: deploying a fixed cash amount through equal scheduled purchases instead of placing the entire amount on one date.
A lump-sum purchase places the entire available cash amount on a single entry date and holds that position for the chosen window.
Regular paycheck contributions were treated as a setting where staged buying is used because a lump sum is not available.
How the overlapping window test was built
One comparison used a 12000 single purchase against twelve 1000 purchases on the first trading day of each month in a broad equity index, then sold all shares at the close of a twelve-month window.
Those twelve-month windows were overlapped by starting each new test one month later from February 1950 through January 2014. An overlapping window test repeats the same holding-period comparison on successive start dates so one start month does not dominate the sample.
Stock dividends and interest on cash waiting to be invested were excluded from the summed test results.
Residual-share size procedure
A residual-share procedure, presented as distinct from equal-dollar staging, sized an opening purchase so a later sale at a chosen rise could recover the cash outlay while still holding a target share count.
Shares to buy were calculated as retained shares plus retained shares times 100 divided by the expected percentage increase. With 100 retained shares and a 25 percent expected rise, that calculation required buying 500 shares and later selling 400 to recover the original outlay.
That later reduction is a scale-out position: reducing a defined share quantity after a defined price rise, including selling down to a residual holding once earlier sales can recover the cash outlay.
Fluctuation adds and cuts
A fluctuation rule added 50 percent more shares after a 25 percent decline and cut the position by 50 percent after a 25 percent rise, then checked whether selling down to 100 shares could bring remaining cost to zero.
Adding a defined extra share quantity after a defined price decline is a scale-in position. The holding grows while the market is moving against the existing position.
After remaining cost reaches zero
After a zero remaining cost was reached on a residual holding, recovered cash was directed to another name to spread exposure while lowering ownership cost. A zero-cost residual is a leftover share count whose original cash outlay has already been recovered by prior sales.
Zero-cost averaging trade sequence at $24 and $18
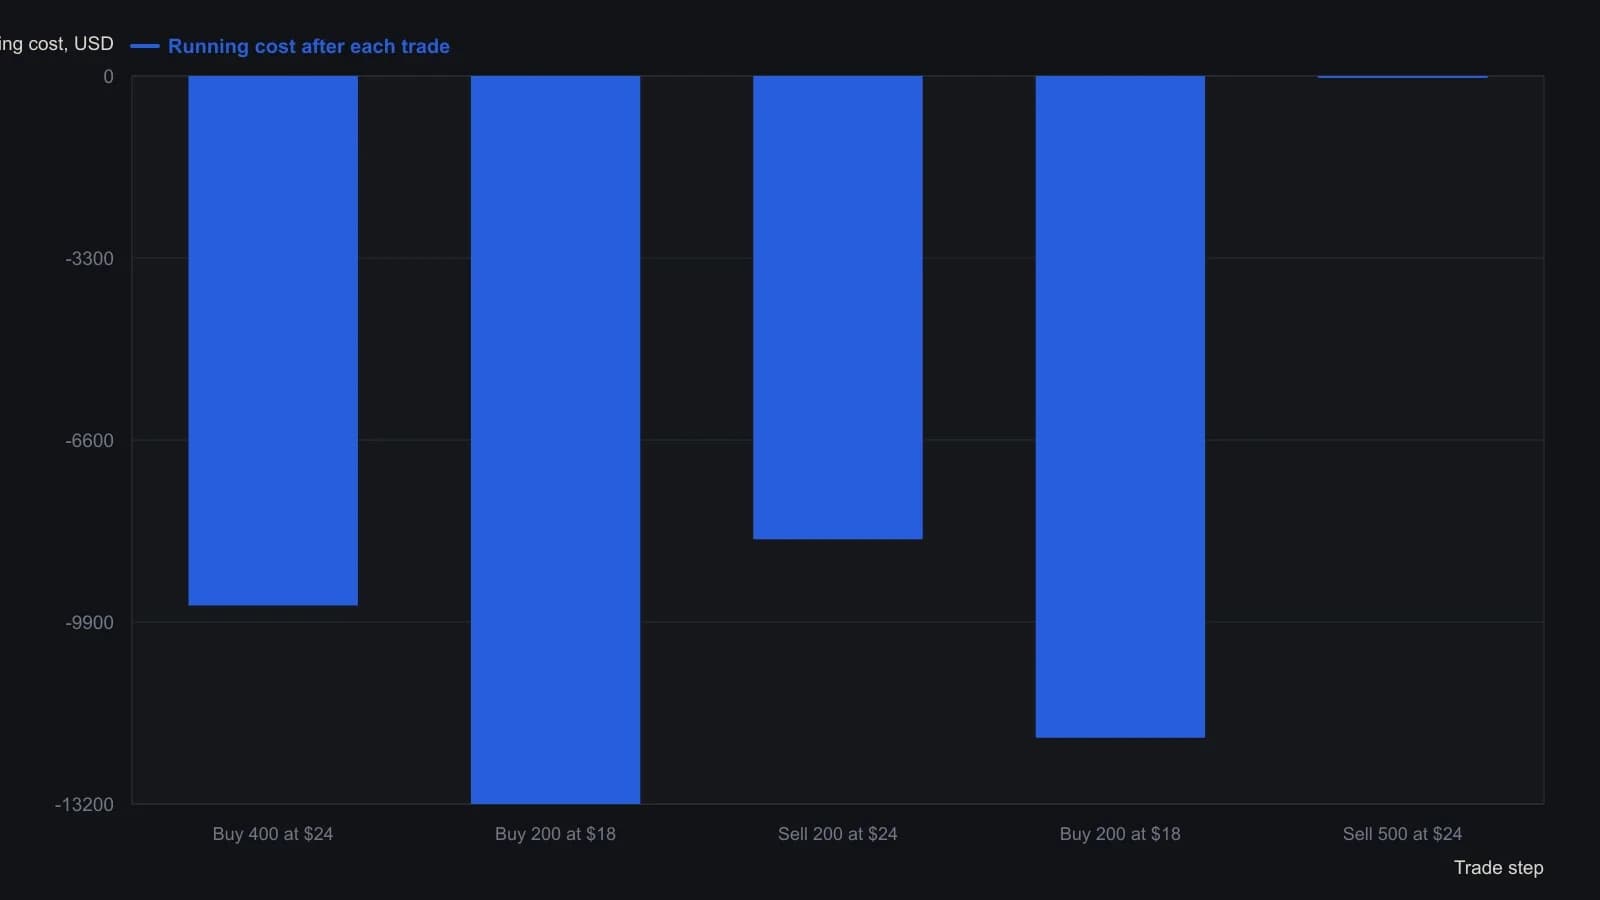
The source fixes a 25% move as a $6 swing and a 50% size change as 200 shares so the arithmetic stays even. Commissions, fees, and taxes are omitted.
All readings on this track · 11 readings
- 1989Testing dollar-cost and scale-in averaging as position-sizing procedures
- 1994Quality screens and dividend-yield regime maps
- 1998Cash recovery grids for residual share construction
- 2001Building custom stock baskets with weights and averaging
- 2012Evaluating dollar-cost averaging as an entry-slot procedure
- 2013Treat a short-term valuation oscillator as an entry-timing filter
- 2014Equal-dollar staging versus lump-sum and residual scaling
- 2015A fund pick is unfinished until cost-drag and the mix are tested
- 2016Broad index allocation, a cash reserve, and staged entries
- 2017Call-ratio overlay versus averaging down on a losing stock
- 2019Overfunding smaller index futures to set leverage