2013issue C0236-39
Treat a short-term valuation oscillator as an entry-timing filter
The archive postponed a long entry after a setup until a short-term valuation oscillator showed undervaluation, and aborted the trade if that condition did not appear soon enough. That wait was compared with random, overvalued, and dollar-cost averaging entries to see whether the undervalued start had smaller initial adverse movement.
- Editorial view: treat the oscillator as an entry-timing filter after a setup, not as a standalone forecast.
- Short-term consensus of fair value sits between -4 and +4, with further bands for slight and plain overvaluation and for minor, plain, and major undervaluation.
- The historical rule-based entry waits for short-term undervaluation and aborts if that condition does not appear soon enough.
- In a one-week archive example, an entry at -8.43 was contrasted with an entry at 5.53 to illustrate smaller initial adverse movement after the undervalued start.
The oscillator times the entry after a setup
The archive placed a short-term valuation oscillator after a setup already existed. The oscillator timed whether a long entry was allowed to go ahead. It did not stand in for the setup.
Editorial view: the practical test is whether waiting for undervaluation after that setup reduces early adverse movement. That is a filter question, not a standalone forecast of the next move.
How the archive marked fair value and extremes
Short-term consensus of fair value was defined as oscillator readings between -4 and +4. Slight overvaluation sat between 4 and 8. Plain overpricing sat above 8.
Minor undervaluation was defined as readings between -4 and -8. Plain undervaluation sat below -8. Major undervaluation sat below -9.
Postpone the long, abort if the wait fails
The proposed procedure postponed a long entry after a setup until the oscillator showed short-term undervaluation. If that condition did not appear soon enough, the trade was aborted.
Editorial view: the wait is a mean-reversion gate on a rule-based entry. Dollar-cost averaging appears in the archive as a separate comparison rule, not as the wait-and-abort rule itself.
A one-week contrast of two entries
In a one-week example, an entry at the week's highest reading of 5.53 was contrasted with an entry at the week's lowest reading of -8.43. The contrast was used to illustrate smaller initial adverse movement after the undervalued entry.
Which random setups the simulator kept
A simulator test of random entries kept only those cases where the oscillator fell below -8 within the next five days. Setups that never reached that threshold were discarded.
Average readings at entry and a bull-market ranking
On a 50-day basis after each entry, average oscillator values at entry were about -0.01 for random, -7.70 for undervalued, 7.53 for overvalued, -0.84 for dollar-cost averaging, and -8.09 for undervalued random entries.
In the bull-market test window, the overvalued-entry rule was barely able to make money and spent several large periods in the red. Dollar-cost averaging beat random entry. Undervaluation buying was the strongest of the compared rules.
Editorial reminder: those results belong to the historical comparison. They do not establish present-day performance and they are not a recommendation to apply any rule.
Postponed undervalued longs versus random longs
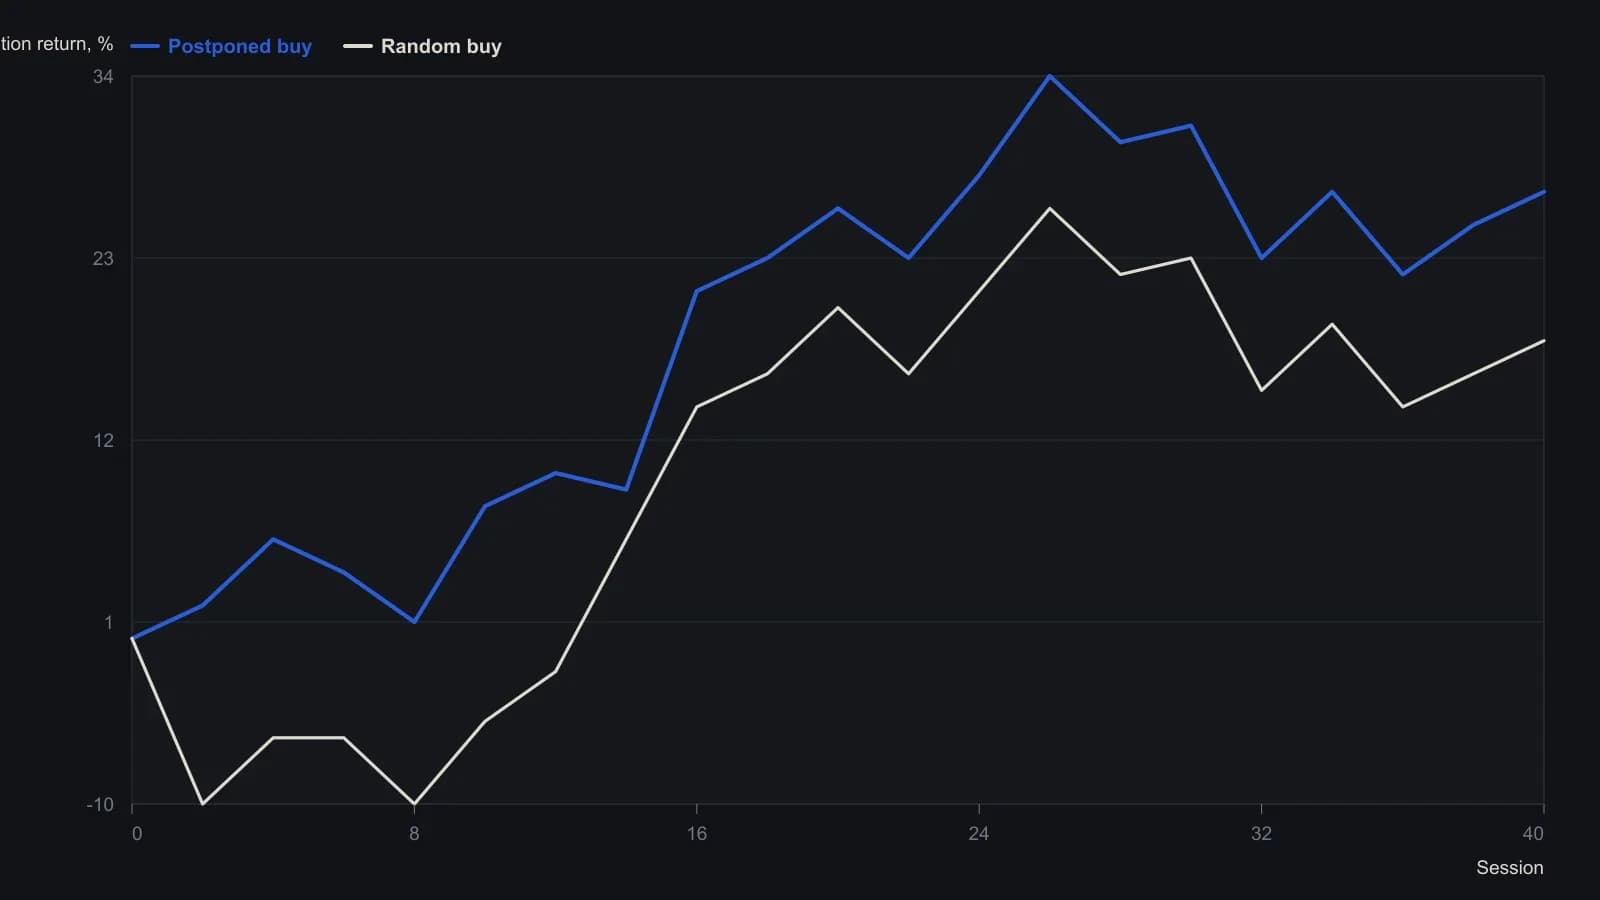
The simulator kept a random long only if CVI fell below -8 within five sessions; otherwise the setup was aborted. Costs were omitted. The source did not label the time axis; x is equally spaced samples from left to right.
All readings on this track · 11 readings
- 1989Testing dollar-cost and scale-in averaging as position-sizing procedures
- 1994Quality screens and dividend-yield regime maps
- 1998Cash recovery grids for residual share construction
- 2001Building custom stock baskets with weights and averaging
- 2012Evaluating dollar-cost averaging as an entry-slot procedure
- 2013Treat a short-term valuation oscillator as an entry-timing filter
- 2014Equal-dollar staging versus lump-sum and residual scaling
- 2015A fund pick is unfinished until cost-drag and the mix are tested
- 2016Broad index allocation, a cash reserve, and staged entries
- 2017Call-ratio overlay versus averaging down on a losing stock
- 2019Overfunding smaller index futures to set leverage