2012issue C0842-45
Evaluating dollar-cost averaging as an entry-slot procedure
Dollar-cost averaging deploys a fixed cash amount at a regular interval. The calendar week chosen inside each contribution interval is an entry-slot, and the archive evaluation shows that starting year and intra-interval slot still change return on capital.
- Dollar-cost averaging deploys the same cash amount at a consistent interval so average purchase cost is formed across successive market states rather than by a single entry.
- That procedure is not the same as comparing yearly high versus low entries or regularly rebalancing winners and losers.
- The entry-slot inside each interval remains time-sensitive: starting year and intra-interval week still change return on capital.
- Lower-volatility stretches delivered higher return on capital and the widest range across alternative quarterly entry slots, while index-level series still carry survivor bias.
What the procedure is
Dollar-cost averaging is a procedure that deploys a fixed cash amount at a regular interval so average purchase cost is formed across successive market states rather than by a single entry.
Classic dollar-cost averaging is not the same procedure as comparing yearly high versus low entries. It is also not the same as regularly rebalancing winners and losers.
How the archive scored the slots
The archive evaluation used quarterly contributions into the Dow Jones Industrial Average. Each scheduled cash amount was converted at the opening price, with no fees.
Outcomes were scored as return on capital: end-of-sample mark-to-market profit expressed against total cash deployed, without compounding dividends. That score is not an accumulation series.
The measured entry-slot was the specific week or month inside each interval when the scheduled cash was converted into the instrument. First-week-of-first-month quarterly entries were compared with first-week-of-third-month entries.
What the comparison showed
The first-month slot produced a higher return on capital than the third-month slot on the long window and on each shorter window. The more volatile stretch still showed a first-month versus third-month difference.
The evaluation concludes that dollar-cost averaging remains time-sensitive. Starting year and intra-interval entry-slot still change outcomes, including a gap between the best and worst slots on the long frame.
Lower-volatility stretches delivered higher return on capital. Those same stretches also produced the largest range of results across alternative quarterly entry slots. The widest first-month versus third-month spread appeared in the lower-volatility window.
DJIA quarterly DCA return by entry month and horizon
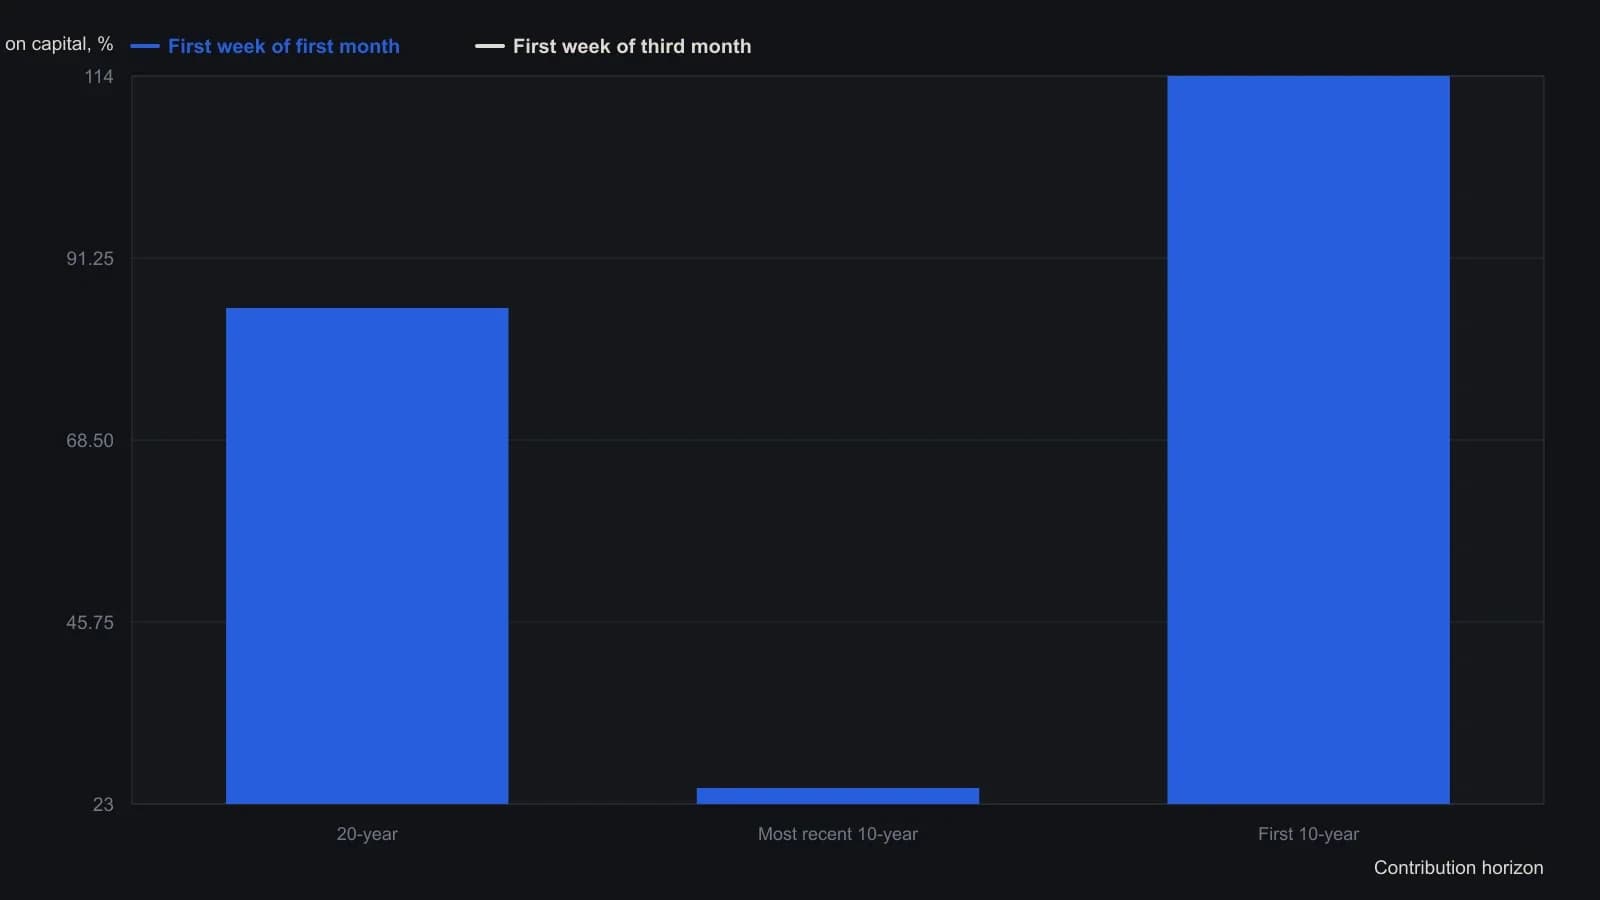
The test adds $10,000 each quarter at the DJIA open in the first week of a fixed month, counts raw price return with dividends omitted, ignores fees, and marks the book to market at the end of 2011. The 20-year book has 84 contributions totaling $840,000; each 10-year book spends $420,000.
Survivor bias in the index series
Index-level dollar-cost averaging still reflects survivor bias because indexes periodically replace underperforming constituents with stronger ones. The measured series is continually rebuilt from current winners.
Survivor bias is the upward tilt of an index that periodically drops weaker constituents and adds stronger ones, so the series always contains current survivors.
All readings on this track · 11 readings
- 1989Testing dollar-cost and scale-in averaging as position-sizing procedures
- 1994Quality screens and dividend-yield regime maps
- 1998Cash recovery grids for residual share construction
- 2001Building custom stock baskets with weights and averaging
- 2012Evaluating dollar-cost averaging as an entry-slot procedure
- 2013Treat a short-term valuation oscillator as an entry-timing filter
- 2014Equal-dollar staging versus lump-sum and residual scaling
- 2015A fund pick is unfinished until cost-drag and the mix are tested
- 2016Broad index allocation, a cash reserve, and staged entries
- 2017Call-ratio overlay versus averaging down on a losing stock
- 2019Overfunding smaller index futures to set leverage