1990issue C121-4
Constructing optimal f when trade sizes differ
Expected value confirms an edge before any fraction is chosen. When wins and losses are unequal, a profit-and-loss list is converted into holding-period returns and the fraction with the highest terminal wealth relative is taken as optimal f.
- Expected value is the average outcome of one trial, formed from win size times win probability plus loss size times loss probability; a result above zero is treated as an edge.
- The Kelly criterion locates the peak fixed fraction only when every win is the same amount and every loss is the same amount.
- When trade outcomes differ in size, the fraction with the highest terminal wealth relative after a profit-and-loss list is converted into holding-period returns is taken as optimal f.
- Contract count is constructed by dividing current equity by the critical value at the chosen f and then stepping the count as equity crosses those thresholds.
Confirm an edge first
The average outcome of one trial is formed as win size times win probability plus loss size times loss probability. A result above zero is described as an edge.
Expected value is that average outcome of one trial, formed from win size times win probability plus loss size times loss probability. A result above zero is treated as an edge.
A unit stake versus the whole stake
In a 2-to-1 even-probability illustration, risking the entire stake after a win lets one later loss empty the account, whereas repeating a one-unit stake would still leave the account ahead.
Where the Kelly criterion applies
The Kelly criterion locates the optimal fixed fraction only when every win is the same amount and every loss is the same amount.
It is a closed-form fixed-fraction rule that locates the peak stake only when every win is the same size and every loss is the same size.
Searching candidate fractions
When trade outcomes differ in size, a profit-and-loss list is converted into holding-period returns at successive candidate fractions, and the fraction with the highest terminal wealth relative is taken as optimal f.
Optimal f is the fixed fraction of equity that produces the highest terminal wealth relative when a historical profit-and-loss list is converted into holding-period returns.
The search begins by dividing the largest loss by 0.01 to form the first critical value, then repeats the holding-period-return product as that divisor is raised toward 1.00.
The critical value is the starting stake used in the search, formed by dividing the largest loss by the candidate fraction under test. A holding-period return is the ratio of successive cumulative stake entries after each trade is scaled by a candidate critical value.
Terminal wealth relative is the product of all holding-period returns for one candidate fraction. The same product is obtained regardless of trade order.
TWR versus f for the 2-to-1 coin toss
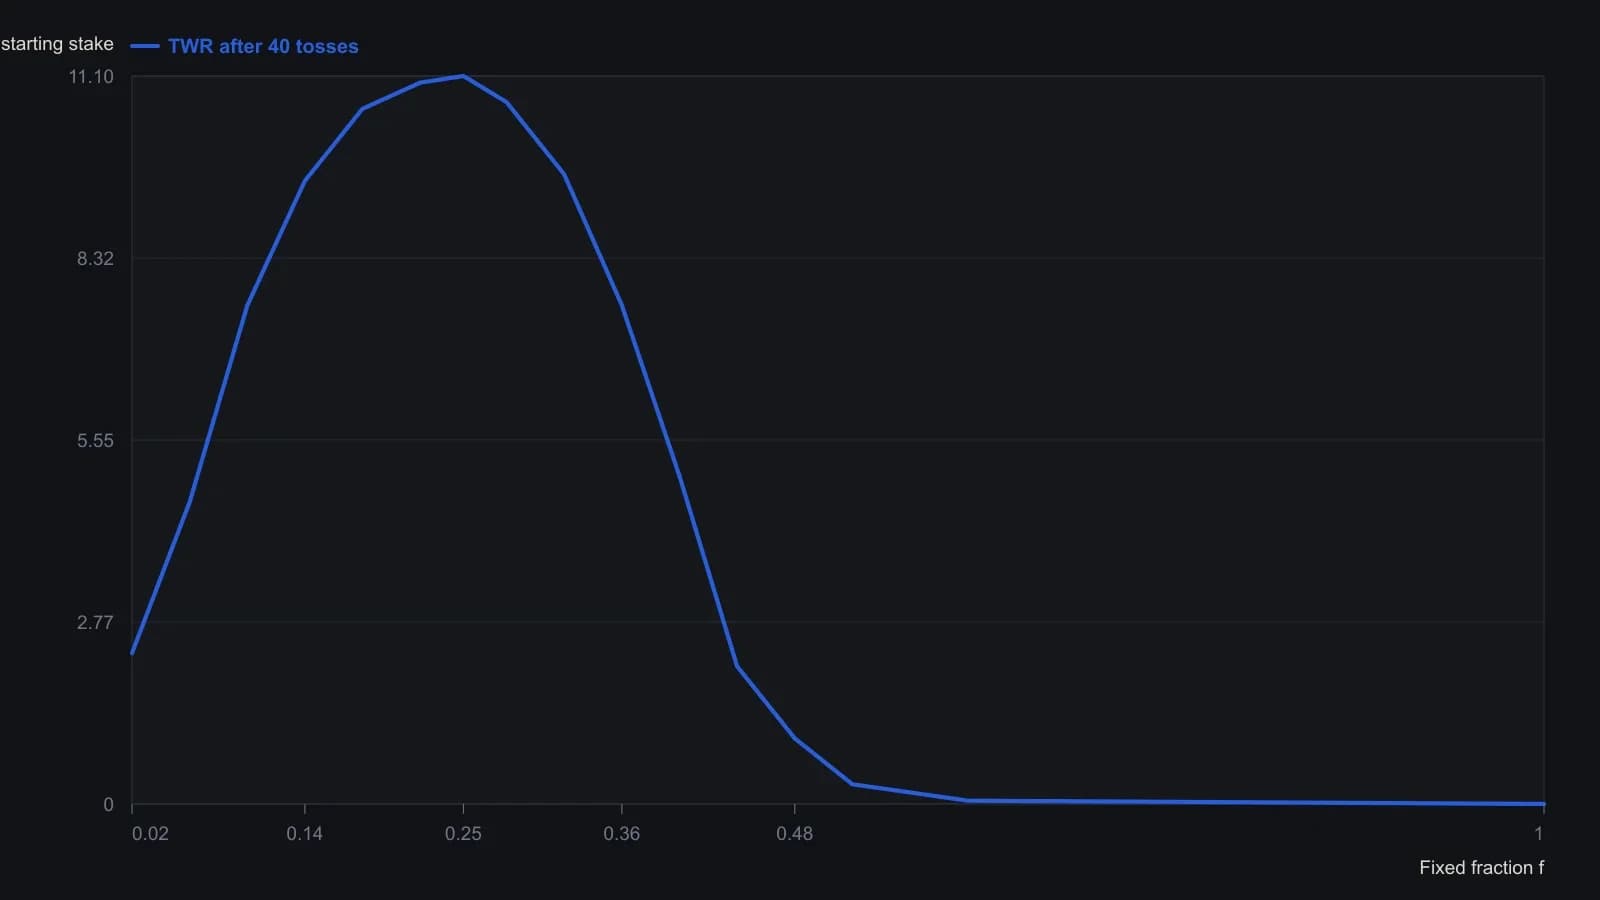
The printed figure is a U-shaped scan of a bell curve (y increasing downward). Y values are the axis labels as printed (TWR / ending multiple of the starting stake). X is the fixed fraction f. Peak location 0.25 and the 0.50 ruin threshold are also stated in the article.
Two constructions of the peak
In the equal-payoff 2-to-1 coin-toss construction, the plotted peak fraction is 0.25. Plotted points at 0.1 and 0.4 sit below half that peak, and plotted points at 0.5 and above fall below the starting stake.
For the four-outcome series -1, -3, 3 and 5, the search peak is an f of 0.32, so the matching critical value is the largest loss divided by that f, or 9.375.
Turning f into a contract count
Contract count is constructed by dividing current equity by the critical value at the chosen f and then stepping the count up or down as equity crosses those thresholds.
All readings on this track · 12 readings
- 1990Constructing optimal f when trade sizes differ
- 1993Portfolio heat, optimal f, and drawdown limits
- 1994Construct historical-optimum-leverage from one equity-path
- 1995Optimal f as a leverage bound for commodity account growth
- 1998Secure f keeps Optimal f sizing inside a Drawdown limit
- 1998Optimal f contract counts versus equity fractions
- 1999Match futures starting capital to system risk
- 1999Search system inputs together with Optimal f sizing
- 2001Bounded crash risk with capital units and optimal f
- 2002Optimal f sizing and risk of ruin as exposure filters
- 2003Cap ruin and drawdown before optimal-f
- 2006Ruin odds, the Kelly fraction and optimal f as size filters