2002issue C061-5
Optimal f sizing and risk of ruin as exposure filters
Optimal f sizing turns historical results into a fixed fraction meant to maximize geometric growth, then into a contract count from the largest loss. Risk of ruin still leaves a positive chance of going bust if trading continues. This editorial treats both as pre-trade filters that bound a survivable loss, not as formulas that pick a growth-maximizing size.
- Optimal f sizing takes a fixed fraction of capital from historical results to maximize geometric growth, then divides that fraction by the largest loss to set contract count.
- Risk of ruin estimates the chance of going bust from win rate and capital units, and a positive chance remains whenever trading continues.
- A stronger historical system raises the implied Optimal f sizing bet and the later drawdown, so one later loss can wipe out the account.
- The historical workflow sets position size from the largest loss that can be tolerated, not from an optimized fraction of capital.
Editorial frame
This editorial reads Optimal f sizing and Risk of ruin as pre-trade exposure filters that bound a loss you can survive. The paragraphs that follow restate the historical workflow. They are not treated here as equations that pick a growth-maximizing bet size.
How Optimal f sizing is defined
Optimal f sizing is defined from a system's historical results as the fixed fraction of trading capital allocated to a trade in order to maximize geometric account growth. That fraction is then divided by the largest loss to set contract count.
Under the common rationale, betting more than Optimal f sizing leads to ruin and betting less leaves the account undergrown.
When the win-to-loss dollar ratio is assumed to be 1, the simplified Optimal f sizing formula is f = 2P - 1. A 51% win rate implies a 2% fraction. A 75% win rate implies a 50% fraction.
What risk of ruin measures
Risk of ruin estimates the chance of going bust given a win percentage and the number of capital units risked per trade. There remains a positive chance of ruin whenever trading continues.
When profit and loss per trade are equal, ruin probability can be written R = ((1 - A) / (1 + A))^C or R = ((1 - W) / W)^C. The result depends only on win rate and capital units.
True optimal f versus win rate
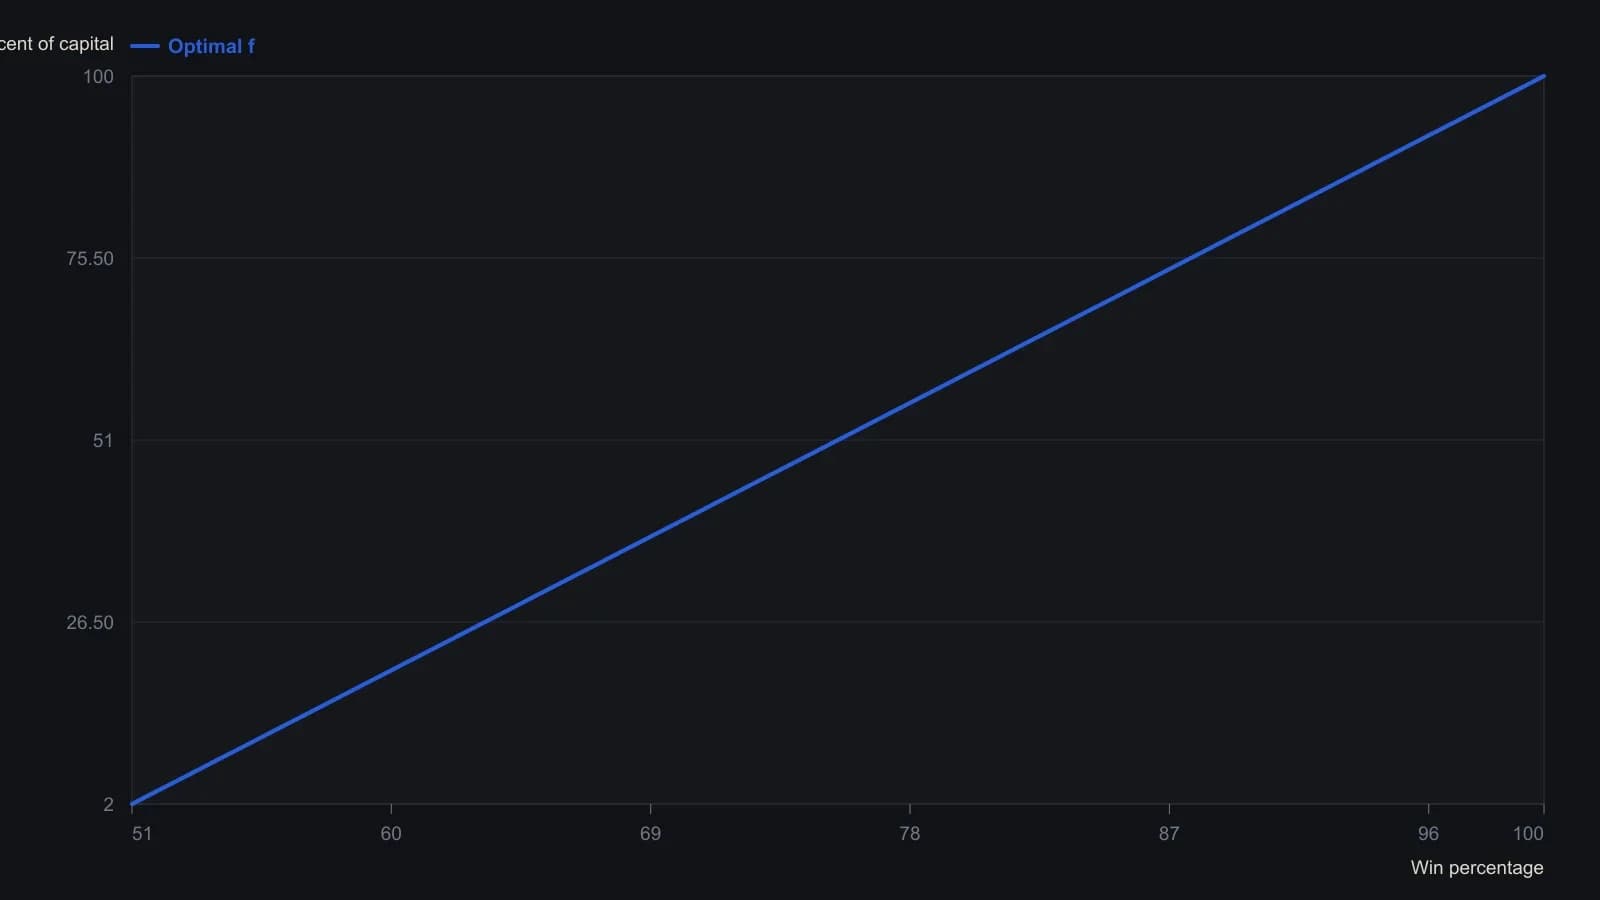
The source assumes a one-to-one dollar win/loss ratio, which reduces optimal f to 2P minus 1.
Why a growth-max fraction is a weak size rule
A stronger historical system raises the implied Optimal f sizing bet. That larger bet also raises eventual drawdown and can make a single later loss large enough to wipe out the account.
A high-percentage winning system paired with a high Optimal f sizing fraction can still show a high chance of going bust.
Writers who compute full Optimal f sizing often then cut it by an arbitrary divisor such as one-half or one-third. That step is little different from choosing an arbitrary percent of capital.
Bound the loss that can be tolerated
The historical workflow sets position size from the largest loss that can be tolerated rather than from an optimized fraction of capital. One worked example never risks more than a 15% drawdown, regardless of how many systems or open positions are held.
All readings on this track · 12 readings
- 1990Constructing optimal f when trade sizes differ
- 1993Portfolio heat, optimal f, and drawdown limits
- 1994Construct historical-optimum-leverage from one equity-path
- 1995Optimal f as a leverage bound for commodity account growth
- 1998Secure f keeps Optimal f sizing inside a Drawdown limit
- 1998Optimal f contract counts versus equity fractions
- 1999Match futures starting capital to system risk
- 1999Search system inputs together with Optimal f sizing
- 2001Bounded crash risk with capital units and optimal f
- 2002Optimal f sizing and risk of ruin as exposure filters
- 2003Cap ruin and drawdown before optimal-f
- 2006Ruin odds, the Kelly fraction and optimal f as size filters