2014issue C1044-49
A 2014 research stack as a classroom for volume-flow hypotheses
A 2014 desktop-and-iPad case packages the Chaikin oscillator, the accumulation-distribution line, and related money-flow tools as chart signals, then pairs them with a Power Gauge-style rating across thousands of stocks. TradersWeek reads that archive as a classroom for writing those pieces into falsifiable hypotheses, not as software shopping advice.
- The 2014 product case describes a desktop-and-iPad research environment that packages the Chaikin oscillator, the accumulation-distribution line, and related money-flow tools as chart signals.
- The same stack pairs those chart signals with a Power Gauge-style rating that covers a universe of thousands of stocks.
- Directional-option screening is framed as selecting names whose Power Gauge ratings sit at the extreme bullish or bearish ends of the scale.
- Swing-trade hypotheses test bullish-rated names that lift from the lower Chaikin volatility band, and test retracements or rallies against an oversold or overbought reading.
What the 2014 environment packaged
The 2014 product case describes a desktop-and-iPad research environment. It packages the Chaikin oscillator, the accumulation-distribution line, and related money-flow tools as chart signals.
In that packaging, the Chaikin oscillator is a volume-weighted oscillator derived from the accumulation-distribution line that converts price-and-volume flow into a signed signal on a defined lookback. The accumulation-distribution line is a running volume-flow series that locates closes within the high-low range and accumulates that signed volume as a chartable structure.
Related money-flow tools sit beside those two series. Money-flow is a volume-weighted reading of buying and selling pressure over a stated window, distinct from raw price momentum.
The reviewed stack is presented as pairing those chart signals with a Power Gauge-style rating covering a universe of thousands of stocks. Power Gauge is a multi-factor stock rating that blends technical, fundamental, and earnings inputs into a bullish-to-bearish classification.
How the review wrote its screens
The case study frames directional-option screening as selecting names whose Power Gauge ratings sit at the extreme bullish or bearish ends of the scale.
Swing-trade hypotheses in the review use Chaikin volatility bands to test buying bullish-rated names that lift from the lower band.
A second swing-trade setup in the same review uses an oversold or overbought reading to test buying retracements in bullish-rated names and selling rallies in bearish-rated names.
The earnings-surprise observation
The review states a general observation that very bullish Power Gauge ratings coincide more often with positive earnings surprises, and very bearish ratings with higher risk of negative surprises.
Valero Energy daily price, mid-2013 through May 2014
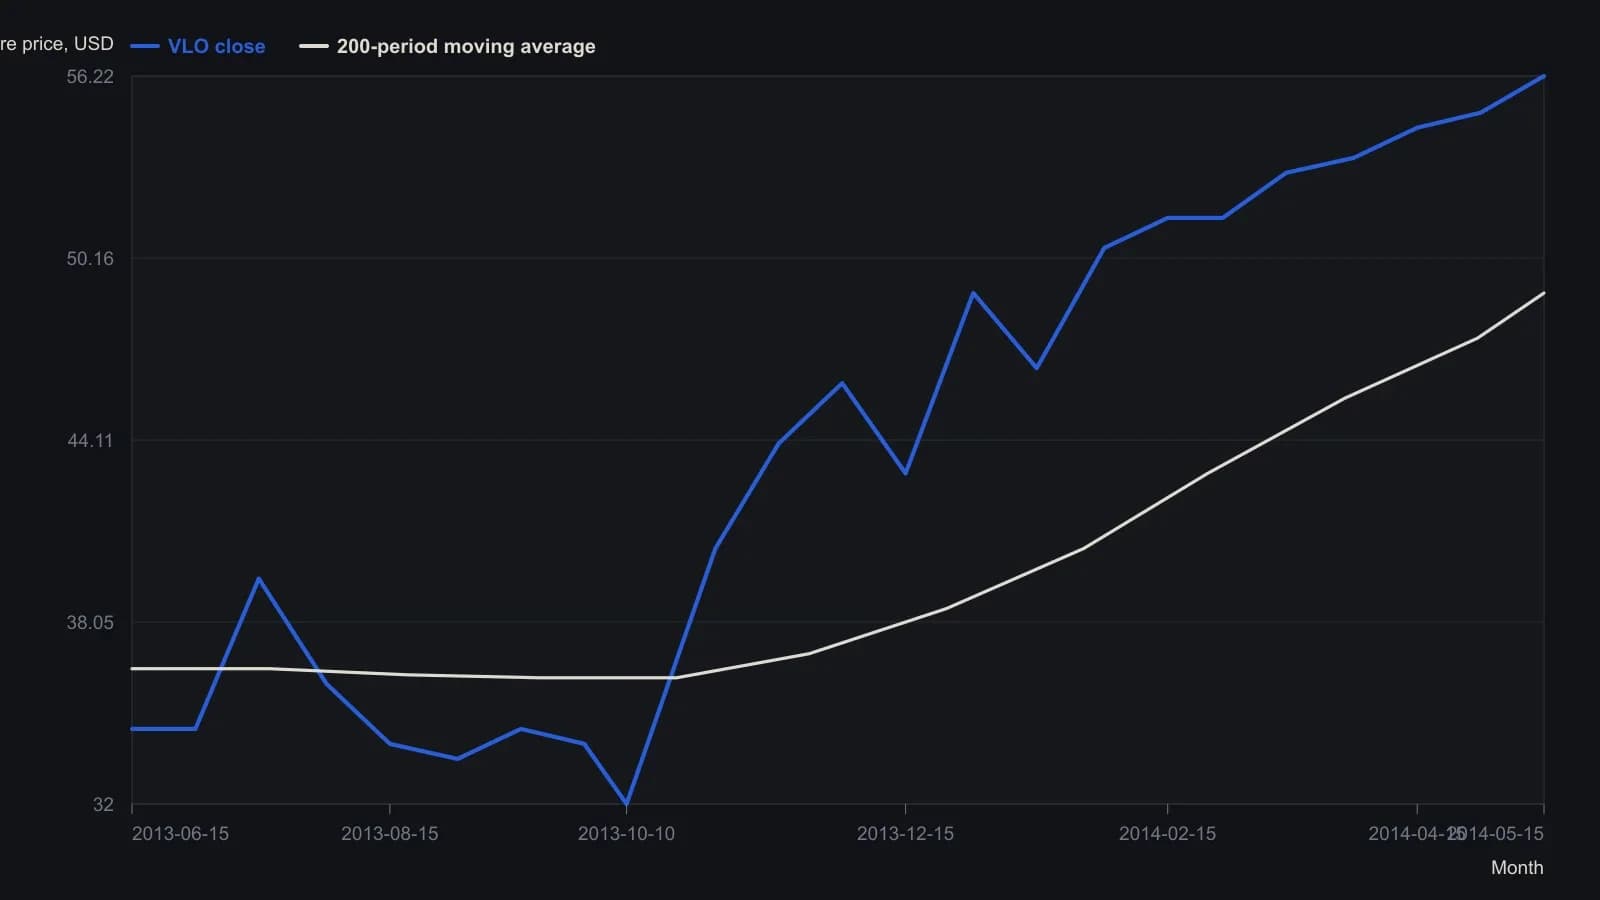
Digitized from a magazine raster of daily candlesticks, so prices are rounded to about a half-dollar except the final header print. Calendar days mark month ticks and visible turns on the axis, not official session dates. The brown overlay is the review’s triple-smoothed 200-period average.
All readings on this track · 9 readings
- 1992Fitting oscillator parameters to stock personality
- 1994Constructing the Chaikin oscillator from close-in-range volume
- 1994Constructing Chaikin money flow and a double-exponential smoother
- 1994A three-lock reversal drill: line, oscillator, and volume
- 2000Constructing a Chaikin oscillator from the accumulation-distribution line
- 2005Volume-spike alerts versus direction from follow-through
- 2014A 2014 research stack as a classroom for volume-flow hypotheses
- 2015Money flow oscillator construction from volume pressure
- 2017Small-cap swing entries that wait for accumulation and Chaikin to clear