1998issue C121-3
When quieter returns lose their survival edge
Under a 50-50 win assumption the quieter stream finished ahead in nearly every run. The paired-path evaluation then finds the modeled hit rate at which a drawdown limit and a risk-of-ruin screen stop preferring the calmer path.
- In the supplied model, return volatility is the scatter of trade results, and wider dispersion is treated as higher volatility.
- Under a 50-50 win assumption the quieter stream finished ahead in nearly every run, and a half-volatility stream finished ahead in about 70 to 80 percent of matched sequences when other conditions were held equal.
- After win probability moved away from even odds, the half-volatility stream generally stayed ahead only at a modeled win rate of 56 percent or below; the streams drew near 56 percent, and the noisier stream finished ahead more often at 57 percent or higher.
- Equity charts of the paired sequences showed the noisier path reaching larger wins while exhausting capital sooner, which is why a bound on loss size is treated as a working control.
This archive note reconstructs a paired comparison of quieter and noisier trade-return sequences. Editorial reading: treat the quieter stream as a survival filter that stays dominant only near chance, then locate the indifference hit rate at which a drawdown limit and a risk-of-ruin screen stop preferring the calmer path.
Recovery asymmetry and the loss bound
In the supplied model, return volatility is the scatter of trade results. Wider dispersion is treated as higher volatility. Recovery asymmetry is the extra percentage gain needed to rebuild equity after a loss of the same nominal size as the original target advance.
A move from 100 units to 120 is a 20 percent rise, but a first 20 percent loss leaves 80 units and then requires a 50 percent rise to reach 120. A drawdown limit is a pre-trade bound on loss size so one adverse result does not force that outsized recovery just to regain the prior goal.
Paired sequences near even odds
Monte Carlo simulation, in this workflow, is repeated random draws of paired trade-return sequences used to compare a quieter equity path with a noisier one under a chosen win probability.
Under a 50-50 win assumption, the quieter stream finished ahead in nearly every run. When other conditions were held equal, a stream with half the volatility of its pair finished ahead in about 70 to 80 percent of matched sequences.
Where the quieter stream loses its edge
After the win probability is shifted away from even odds, the half-volatility stream generally beat the noisier stream only while the modeled win rate stayed at 56 percent or below. Near a 56 percent win rate the two streams drew. At 57 percent or higher the noisier stream was more often the one that finished ahead.
That crossing is the indifference hit rate: the modeled winning percentage at which the quieter and noisier streams finish ahead equally often. Setting the quieter stream to 75 percent of the noisier stream's volatility moved the indifference win rate only from 56 percent to 57 percent, so hit rate outweighed volatility in that simulation.
Share of runs where the quieter stream beats the noisier stream
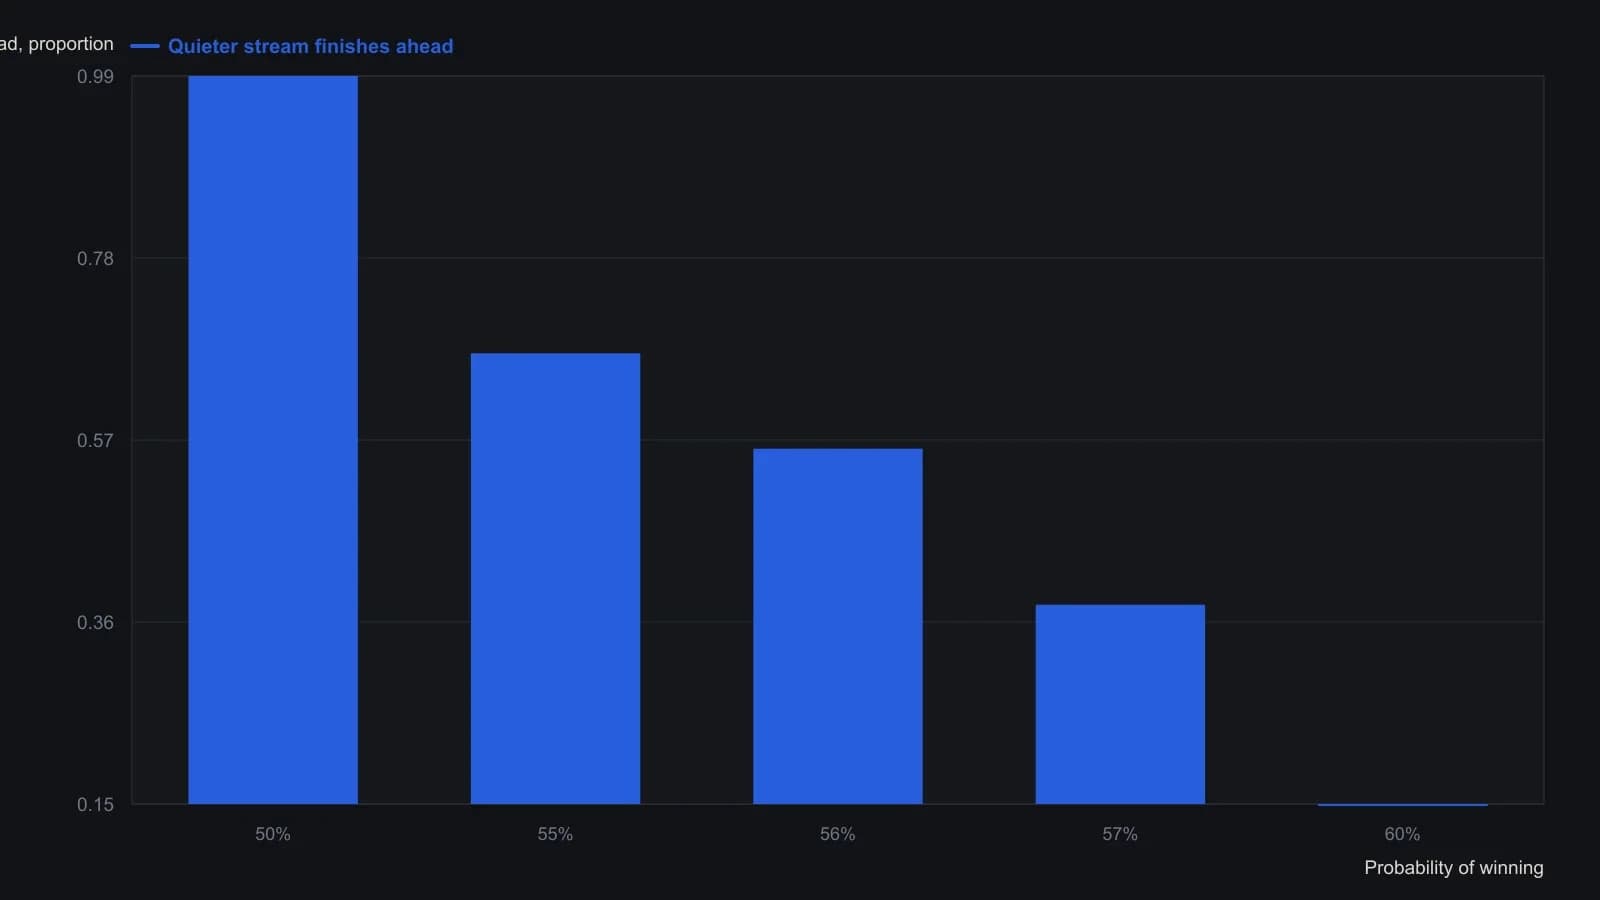
Each marker is the high-low range of repeated worksheet runs with the average as the tick; the source used half volatility versus the noisier stream and noted the x-axis spacing is not even.
Risk of ruin on the noisier path
Risk of ruin is the chance that a noisier equity path exhausts capital sooner even when it can also produce larger wins. Equity charts of the paired sequences showed the noisier path reaching larger wins while exhausting capital sooner, which is why a bound on loss size is treated as a working control.
How the worksheet rebuilt the comparison
The worksheet builds the comparison by setting win probability away from 0.5, extending period columns, and redrawing both equity lines after each recalculation.
All readings on this track · 24 readings
- 1985Forced-close odds from monthly edge and leverage
- 1986Constructing a pre-entry risk filter on price-ratio grids
- 1991Ratchet the halt floor and stage exposure against cash
- 1992Sizing capital from degraded records and volatility
- 1992Filter size by expected value and ruin
- 1995Risk of ruin as a pre-entry position filter
- 1995Filter leverage by sequence-loss odds
- 1996Grading track records by drawdown, expected value, and ruin
- 1998When quieter returns lose their survival edge
- 1999Loss response versus a precommitted trading process
- 1999Reauthorize ruin and drawdown filters after a winning stretch
- 2000Sold premium, survivorship, and ruin bounds
- 2001Monte Carlo drawdown risk and volatility position sizing
- 2001Alertness is a size filter, not a mood
- 2002A constant percent risk bound beats a higher win rate
- 2010Risk of ruin with fractional and reserve betting
- 2014Payout identity, expectancy, and path-dependent ruin
- 2015Spreading names is not a substitute for a ruin bound
- 2015Prestige labels versus one testable trade procedure
- 2015Closed-trade quality screens before sizing risk
- 2019Size mini futures from drawdown and leftover margin
- 2019Starting account size as a survival filter
- 2019Pre-entry ruin and volatility caps for short options
- 2020Forced margin, stop-loss, and ruin risk in 2020