2001issue C021-5
Monte Carlo drawdown risk and volatility position sizing
A Monte Carlo simulation can collect closed-trade profit or loss with the risk assigned to each trade, replay those pairs in randomly chosen order, and reset size from current equity. The share of sequences whose worst closed-trade drawdown stays inside a stated goal becomes a survival-style reading of the chosen risk percent.
- A Monte Carlo simulation can replay closed-trade profit or loss together with assigned risk in randomly chosen order across many sequences.
- Contract or share count is reset from a stated percent of current equity divided by that trade's risk, so size changes with account level and stop-defined exposure.
- The fraction of sequences whose worst closed-trade drawdown stays at or below a stated goal is converted to a survival-style probability for the chosen risk percent.
- Risk percent, drawdown goal, stay-inside probability, and average return are logged together so one historical path is not treated as typical.
Collect closed trades and reshuffle them
A Monte Carlo simulation can be built by collecting closed-trade profit or loss together with the risk assigned to each trade, then replaying those pairs in randomly chosen order across many sequences.
Size each replay from current equity
In each replayed sequence, contract or share count is reset from a stated percent of current equity divided by that trade's risk, so position size changes with both account level and stop-defined exposure.
Track the worst closed-trade drawdown
After each simulated closed trade, equity is updated and closed-trade percent drawdown is measured from the running equity high, retaining the worst drawdown seen in that sequence.
Across the random sequences, the fraction whose worst closed-trade drawdown stays at or below a stated drawdown goal is converted to a probability, giving a survival-style reading of the chosen risk percent.
PIR fast and slow Buff volume-weighted averages
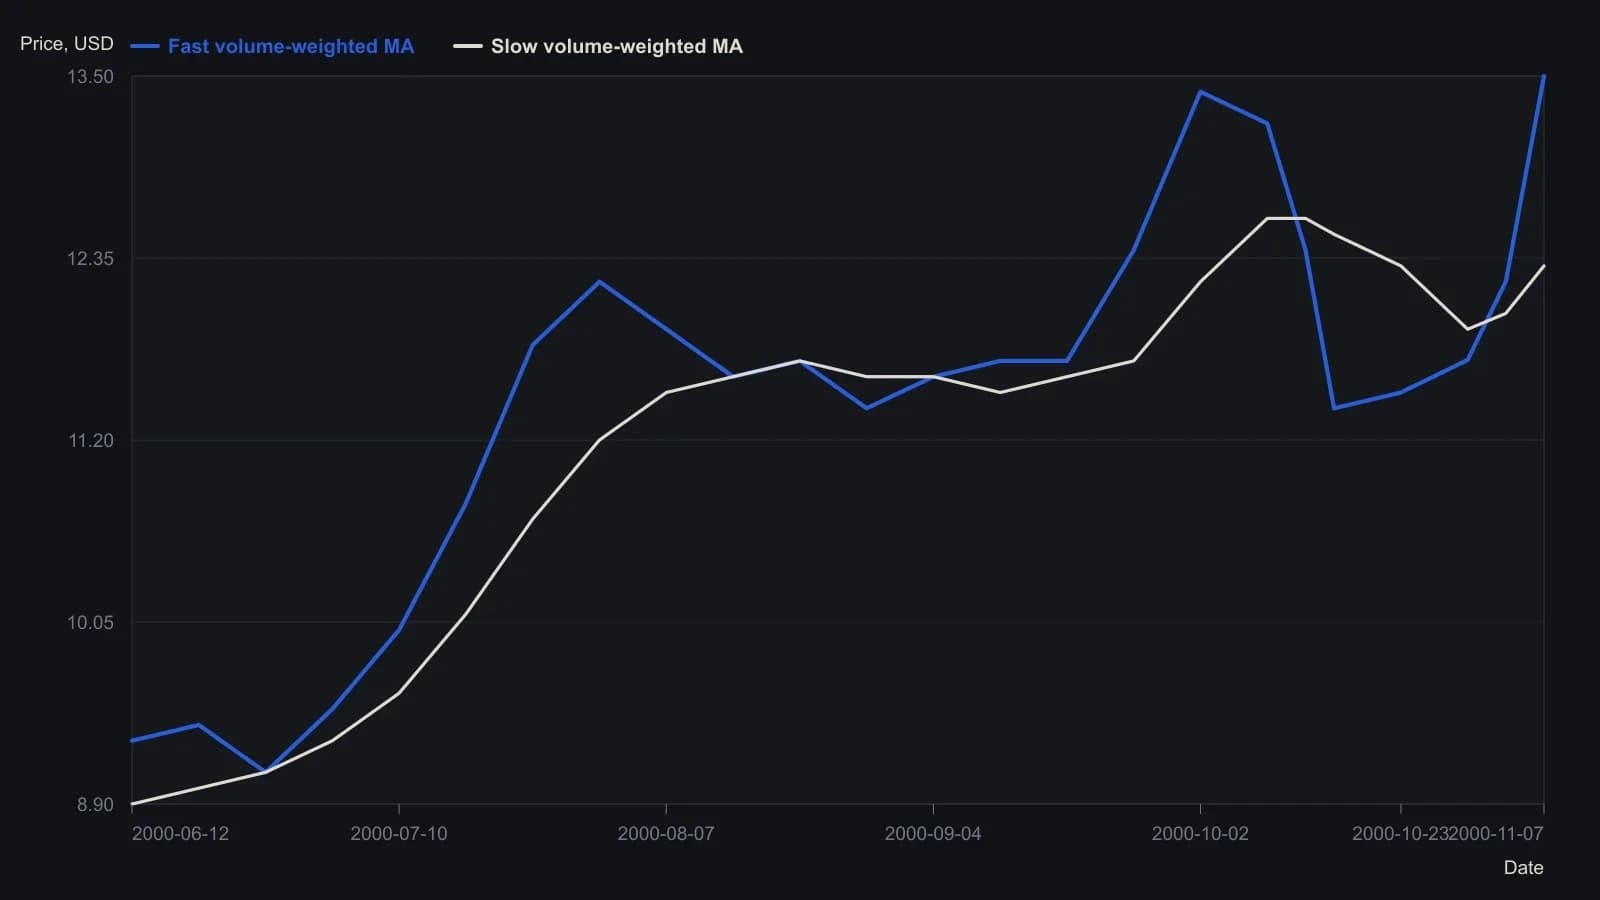
Digitized from the raster. Except for the 11.706 header print on 30 October 2000, levels are approximate to about 0.1. Candlestick highs and lows were not transcribed.
Log growth beside the survival reading
Average percent return across the same sequences is accumulated from starting account size so a sizing setting can be compared on both typical growth and the chance of staying inside the drawdown bound.
The procedure logs risk percent, drawdown goal, drawdown-stay-inside probability, and average return together, so a trader can inspect how a bounded exposure choice maps to ruin-related outcomes before treating any one historical path as typical.
All readings on this track · 24 readings
- 1985Forced-close odds from monthly edge and leverage
- 1986Constructing a pre-entry risk filter on price-ratio grids
- 1991Ratchet the halt floor and stage exposure against cash
- 1992Sizing capital from degraded records and volatility
- 1992Filter size by expected value and ruin
- 1995Risk of ruin as a pre-entry position filter
- 1995Filter leverage by sequence-loss odds
- 1996Grading track records by drawdown, expected value, and ruin
- 1998When quieter returns lose their survival edge
- 1999Loss response versus a precommitted trading process
- 1999Reauthorize ruin and drawdown filters after a winning stretch
- 2000Sold premium, survivorship, and ruin bounds
- 2001Monte Carlo drawdown risk and volatility position sizing
- 2001Alertness is a size filter, not a mood
- 2002A constant percent risk bound beats a higher win rate
- 2010Risk of ruin with fractional and reserve betting
- 2014Payout identity, expectancy, and path-dependent ruin
- 2015Spreading names is not a substitute for a ruin bound
- 2015Prestige labels versus one testable trade procedure
- 2015Closed-trade quality screens before sizing risk
- 2019Size mini futures from drawdown and leftover margin
- 2019Starting account size as a survival filter
- 2019Pre-entry ruin and volatility caps for short options
- 2020Forced margin, stop-loss, and ruin risk in 2020