1995issue C041-11
Filter leverage by sequence-loss odds
Editorial reading: treat contract count as a before-the-sequence filter. Keep a leverage setting only if your own closed-trade history still leaves the chance of finishing underwater, and the chance of a 40 percent draw, inside the loss the live account can absorb.
- After a closed long or short sequence with no external cash flows, ending equity equals starting equity multiplied by the product of one plus leverage times each trade return.
- When historical trade returns are held fixed and leverage is raised, the compounded equity path typically rises then falls through zero. The leverage at that peak is not identified as optimal because the curve does not incorporate risk.
- Resampling those returns in random order at a chosen leverage produces outcome frequencies without a named return distribution. When mean trade return and its dispersion are positive, the chance of finishing below starting equity, and the chance of a 40 percent or larger loss, both rise with leverage.
- Editorial reading: keep a leverage setting only if those two chances still sit inside the loss the live account can absorb, and treat the setting as revisable after results change.
Contract count before the sequence
After a closed sequence of long or short trades with no external cash flows, ending equity equals starting equity multiplied by the product of one plus leverage times each trade return.
Editorial reading: treat contract count as a before-the-sequence filter under Leverage control, Risk of ruin, and Margin management. Keep a leverage setting only if your own closed-trade history still leaves the chance of finishing underwater, and the chance of a 40 percent draw, inside the loss the live account can absorb.
Raising leverage on a fixed history
When historical trade returns are held fixed and leverage is raised as a decision variable, the compounded equity path typically rises then falls through zero, so leverage past the peak can exhaust the account.
The leverage that maximizes that historical compounding curve is not identified as optimal because the curve does not incorporate risk.
Loss odds from resampled returns
Resampling historical trade returns in random order and compounding them at a chosen leverage produces frequency diagrams of later equity outcomes without assuming a named return distribution.
About 100 forward trades and at least 100 resampled paths are treated as enough to estimate mean outcome, variance, and the chance of finishing below starting equity.
For a long enough sequence the log of the equity multiplier is treated as approximately normal, so outcome probabilities can be read from a lognormal model of the multiplier. Estimating the return standard deviation used there is described as requiring at least 30 completed trades.
At leverage 3 and a 100-trade horizon, simulated frequencies moved toward the theoretical curve as the number of paths rose from 100 to 500 to 2,000.
When mean trade return and its dispersion are positive, the chance the equity multiplier finishes below 1 is a strictly increasing function of leverage. Defining a severe loss as 40 percent or more of starting capital, that chance also rises with leverage and approaches the simple chance of any loss.
Loss odds after 100 trades versus leverage
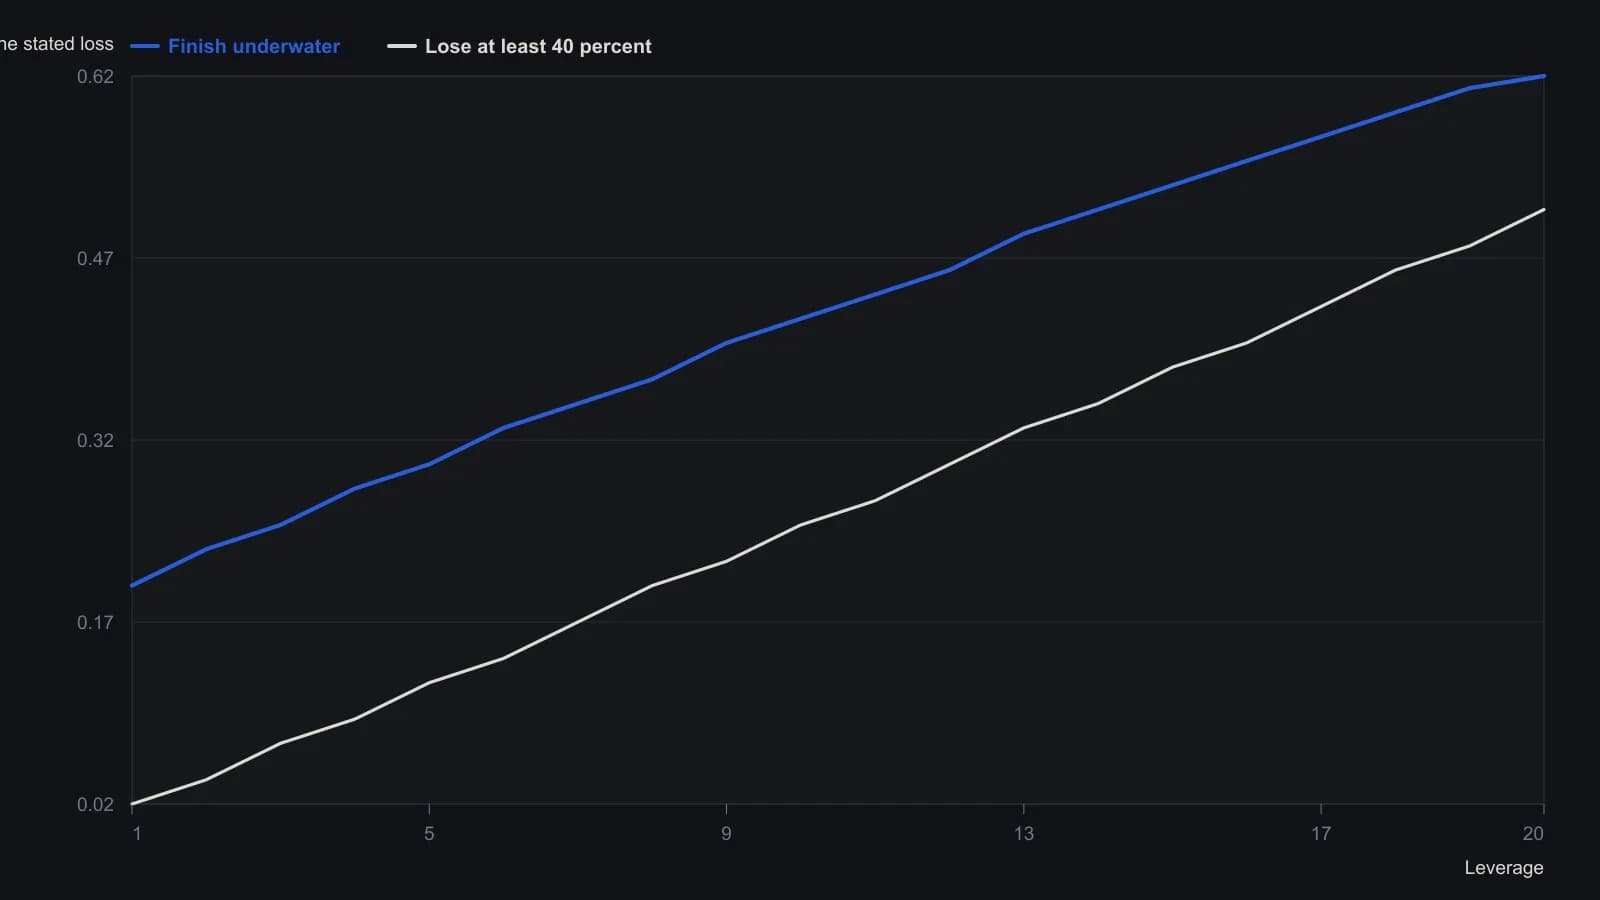
Same leverage on every trade; n = 100 steps; lognormal approximation using the sample mean and standard deviation of the article’s trade returns. Raster reading is approximate to about 0.01.
A revisable capital-protection setting
Because a live account can be forced out by the order of losses even when the full-sequence product is positive, the modeled full-path results are described as generous.
Leverage is framed as a revisable capital-protection policy that can be re-estimated after results change and, if capital is thin, examined over a shorter horizon of 10 or 20 trades.
Editorial reading: use the chance of finishing underwater and the chance of a 40 percent or larger draw as the filter on the setting. If either chance sits outside the loss the live account can absorb, do not keep that leverage.
All readings on this track · 24 readings
- 1985Forced-close odds from monthly edge and leverage
- 1986Constructing a pre-entry risk filter on price-ratio grids
- 1991Ratchet the halt floor and stage exposure against cash
- 1992Sizing capital from degraded records and volatility
- 1992Filter size by expected value and ruin
- 1995Risk of ruin as a pre-entry position filter
- 1995Filter leverage by sequence-loss odds
- 1996Grading track records by drawdown, expected value, and ruin
- 1998When quieter returns lose their survival edge
- 1999Loss response versus a precommitted trading process
- 1999Reauthorize ruin and drawdown filters after a winning stretch
- 2000Sold premium, survivorship, and ruin bounds
- 2001Monte Carlo drawdown risk and volatility position sizing
- 2001Alertness is a size filter, not a mood
- 2002A constant percent risk bound beats a higher win rate
- 2010Risk of ruin with fractional and reserve betting
- 2014Payout identity, expectancy, and path-dependent ruin
- 2015Spreading names is not a substitute for a ruin bound
- 2015Prestige labels versus one testable trade procedure
- 2015Closed-trade quality screens before sizing risk
- 2019Size mini futures from drawdown and leftover margin
- 2019Starting account size as a survival filter
- 2019Pre-entry ruin and volatility caps for short options
- 2020Forced margin, stop-loss, and ruin risk in 2020