2016issue C0317-22
A three-layer sector map around a policy-meeting week
A historical sector-etf-panel built volume-profile maps on an in-sample-window, then inspected later out-of-sample-bars so reactions at projected supply-and-demand-areas were not used in the calculation. High-volume zones were treated as large-participant-footprints, thin-poc lines as likely acceleration prices, and Fibonacci retracements as independent checkpoints for a still-intact trend.
- A volume-profile map of S&P 500 sector ETFs can be built on an in-sample-window and then inspected on withheld out-of-sample-bars, so later reactions at projected supply-and-demand-areas are not used in the calculation.
- High-volume zones are read as large-participant-footprints: a later reject is continued interest, while acceptance is weakening interest and possible chop.
- A fibonacci-checkpoint is a second, independent location that can confirm or reject a volume-profile trend hypothesis.
- The closing rule paired large-participant volume locations with price action at key Fibonacci retracements to judge where supply and demand looked strongest or weakest.
A live exam for a sector-etf-panel
Editorial reading: a scheduled policy-meeting week can be treated as a live exam for a three-layer sector map. Auction volume zones act as the execution filter. Wyckoff-style large-participant-footprints act as the behavioral hypothesis. Fibonacci retracements act as the independent checkpoint that can falsify a still-intact trend.
The archive workflow built a volume-profile map of S&P 500 sector ETFs on an in-sample-window and then inspected later withheld bars. That split kept reactions at projected supply-and-demand-areas out of the calculation.
The demonstration used a daily XLB chart ending August 17, 2015, with 800 in-sample bars, then extended the view to September 17, 2015, while a policy-meeting update was pending.
What the XLB overlay marked
On that XLB map the overlay marked three main points of control inside high-volume zones, five minor points of control, and one point of control inside a weak-volume-area. Those point-of-control levels were then projected onto later bars.
How the color zones were read
High-volume blue zones are treated as prior large-participant-footprints. A later revisit that rejects price is read as continued interest. Acceptance into the zone is read as weakening interest and possible chop.
Editorial reading: a later revisit is the Wyckoff-style test of whether that large-participant-footprint is still active.
Low-participation green zones are treated as prices with little large-participant interest. The working assumption is that price can accelerate through them if the broader economic scenario is unchanged.
Thin red point-of-control lines are treated as a thin-poc, a narrow high-volume price where stop orders may cluster. A cross of those lines is expected to produce acceleration.
What later XLB bars showed
In the extended XLB window, a later decline halted at a major blue-zone point of control near 39.50 and produced a fast rejection. That reaction was read as still-active buying interest at that level.
Energy, financials, and the rest of the panel
After August 17, 2015, XLE broke below 65.78, traveled quickly through the weak-volume-area beneath it, then recovered. That left 65.78 as the next resistance and a higher blue zone near 75.00 as a farther upside reference.
XLF was read as still in an uptrend because the latest pullback did not break the first 61.8% Fibonacci retracement, while price also remained boxed between main points of control at 22.00 and 24.20.
Editorial reading: that 61.8% retracement is the fibonacci-checkpoint. It is the independent location that can confirm or reject the volume-profile uptrend hypothesis.
Across the remaining sectors, Fibonacci failure or hold was used with the volume map. XLU's 50% retracement did not hold. XLI showed 49% of volume near the highs and a weak-volume risk below 47.60.
The closing rule paired large-participant volume locations with price action at key Fibonacci retracements to judge where supply and demand looked strongest or weakest.
XLB daily price against the 39.50 control
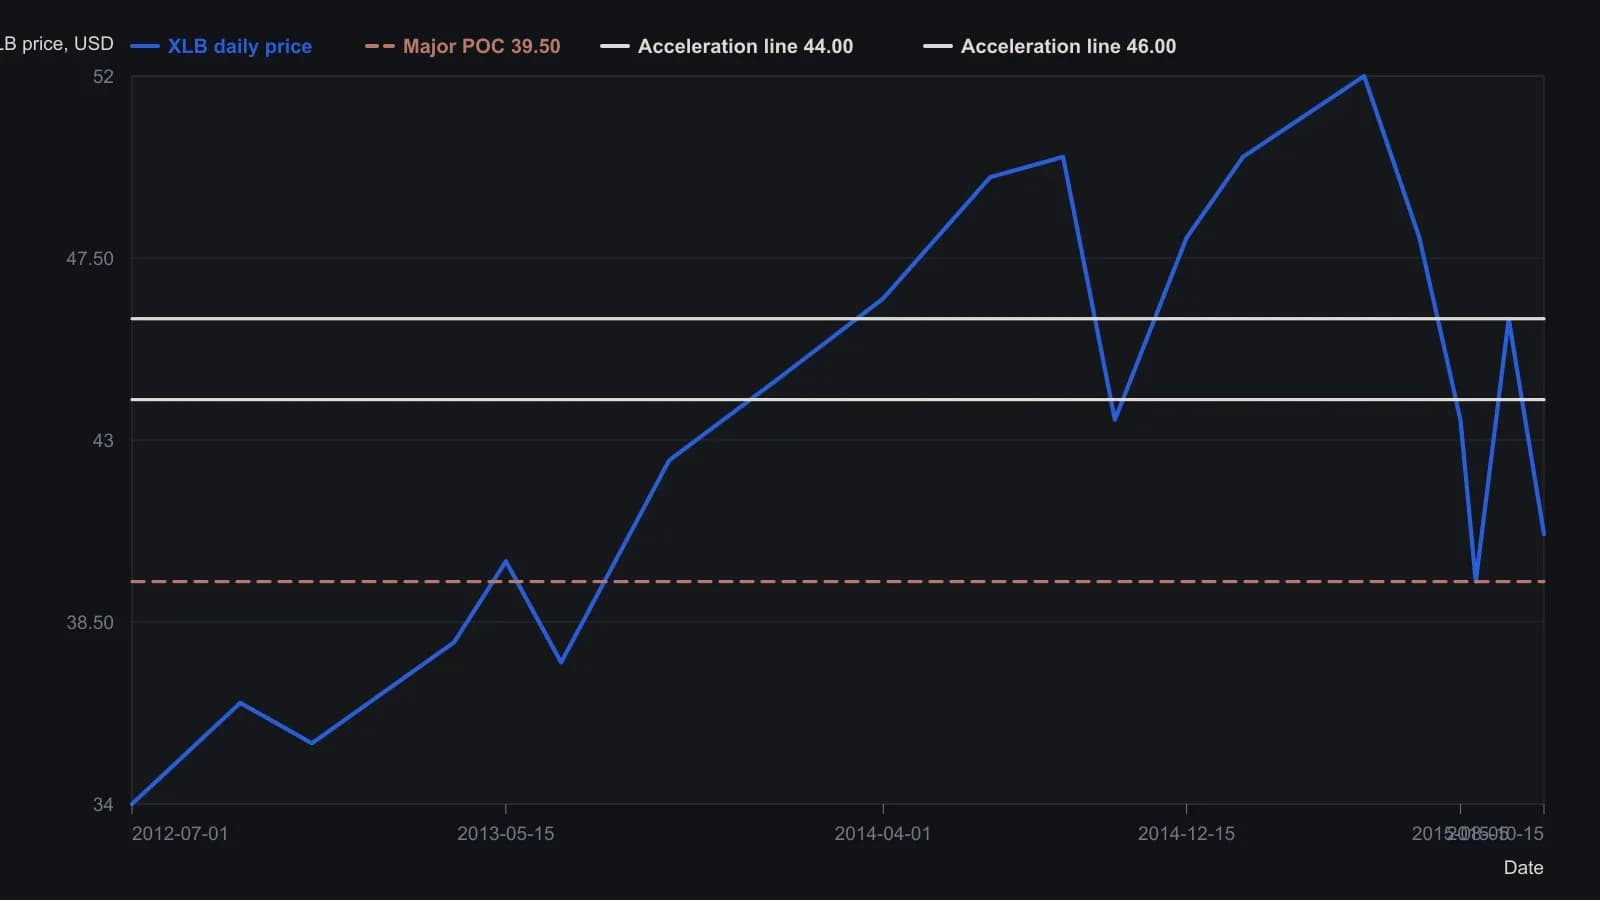
The volume-profile overlay used 800 in-sample daily bars ending 17 August 2015; later bars were held out so reactions at these areas were not part of the calculation.
All readings on this track · 8 readings
- 2005Decaying volume bands as leftover auction inventory
- 2008Constructing equal-volume and open-interest auction zones
- 2010Constructing daily volume-profile breakout levels
- 2010Building volume profile maps for support and resistance
- 2015SPY volume profile as a support and breakout map
- 2016A three-layer sector map around a policy-meeting week
- 2017A three-part liquidity screen before a futures idea is executable
- 2020A two-gate liquidity filter before futures order selection