2015issue C0632-33
SPY volume profile as a support and breakout map
A completed volume profile can be read as a pretest map. Later hourly bars are then scored on the same levels: hold or fail at a concentrated point of control, travel quickly through a thin-volume band, or treat a breakout as confirmed only after the old reference is broken and held.
- Volume analysis relates traded volume to price so balanced and imbalanced supply and demand can be marked as later entry or exit references.
- High-volume bands and points of control are treated as candidate hold-or-fail levels, while low-volume bands are thin areas that later price often crosses quickly.
- A narrow point of control is read as a single support or resistance price after which a confirmed breakout can accelerate. A blurred point of control is treated as an unclear auction and a reason to stand aside.
- In this case, a longer-horizon upside reading stayed unconfirmed until price broke out and held the upper narrow point of control.
A finished profile as a pretest map
Volume analysis relates traded volume to price in order to mark where supply and demand look balanced or imbalanced. Those areas are then treated as candidate entry or exit references.
As an editorial reading, TradersWeek treats a completed volume profile as a pretest map. Later hourly bars are scored on the same mapped levels instead of being given a new set of references after each session.
How volume bands are read
High-volume bands are treated as strong prior supply and demand where later price often slows. Medium-volume bands are treated as ordinary slowing zones. Low-volume bands are treated as thin areas that later price often crosses quickly.
A high-volume area is therefore a dense prior auction that can slow later passage. A low-volume area is a thin stretch that is expected to be crossed quickly once price enters it.
Narrow, wide, and blurred points of control
The point of control is the price or band with the heaviest volume concentration. It is treated as the clearest shared auction reference.
A narrow point of control is read as a concentrated reference that can act as a single support or resistance level, after which a breakout can accelerate. A wide point of control is still treated as support or resistance, but as a band rather than one price. A blurred point of control is treated as an unclear auction where chopping is expected and no trade is advised.
The mapped SPY swing
The December 5, 2014 SPY volume profile covered the February 5 to December 5, 2014 swing in the 175 to 208 range.
That profile showed a narrow point of control at 207.4, a thin-volume band from 204 to 207, a narrow point of control at 204, a thin-volume band from 202 to 204, and a heavy supply-and-demand band from 192 to 198.
SPY volume-profile map after the 2014 swing
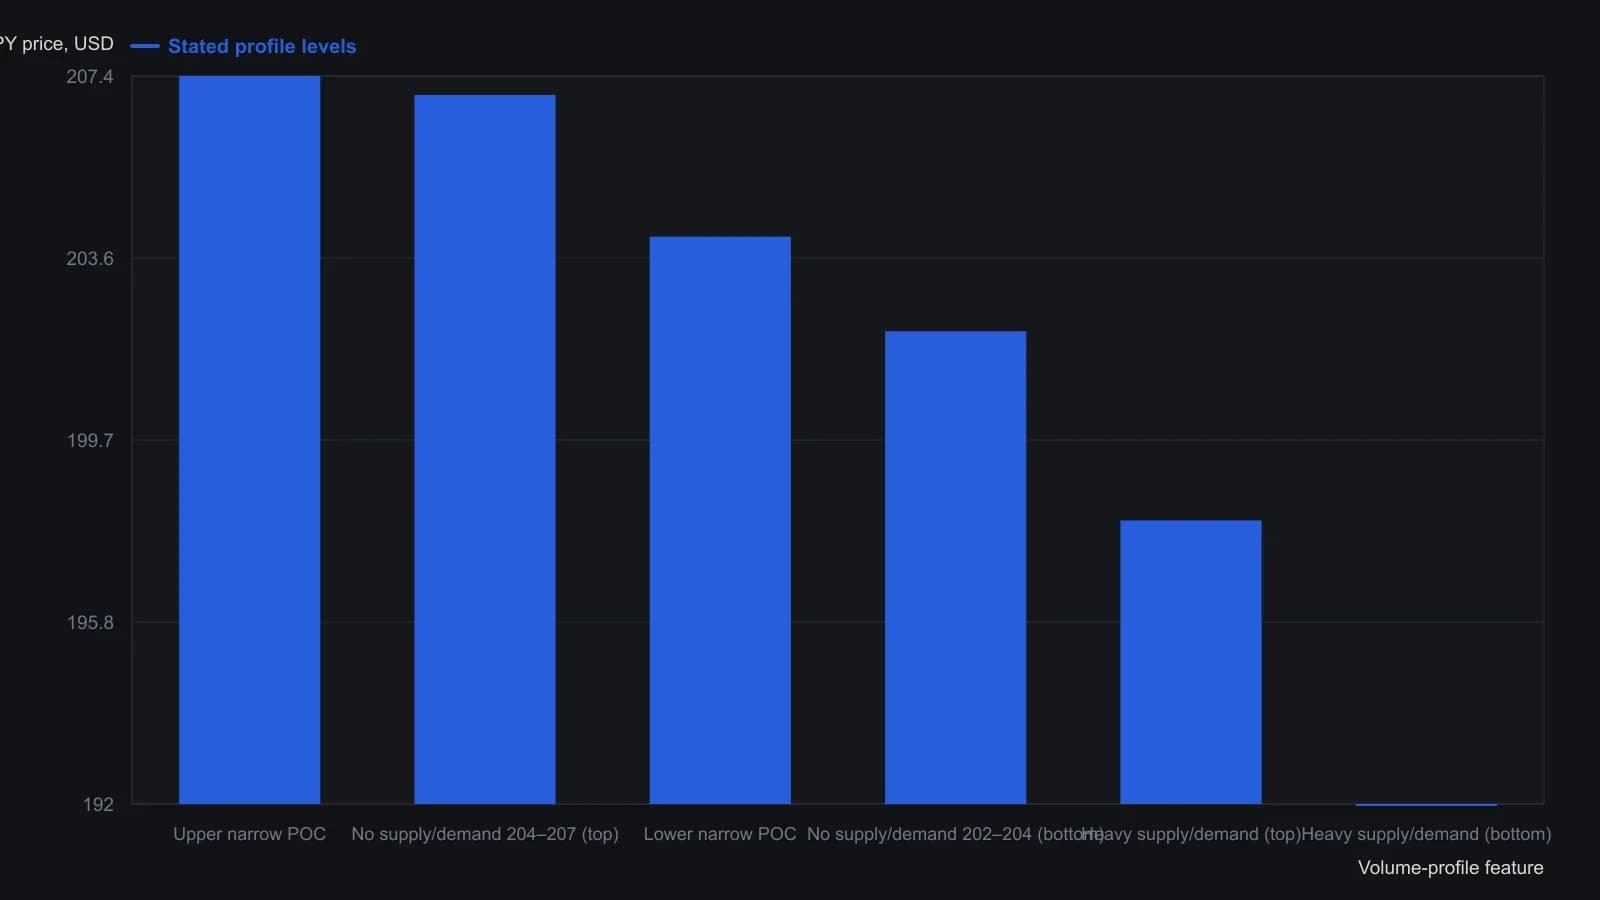
Profile built with Trend Profile Pro on TradeStation for the swing from 5 February 2014 to 5 December 2014; the source gives that swing’s range as 175–208 dollars. Histogram bar widths were not recovered as numeric volume.
Later hourly bars on the same levels
On the later hourly path, December 8, 2014 broke 207.4 and moved quickly through 204 to 207 before rejection at 204. December 10 temporarily broke 204. December 11 broke 204, moved quickly through 202 to 204, and was rejected at the top of 192 to 198.
On December 18, 2014 a gap above 204 was followed by a quick test and a rally that stopped at 207.4.
As an editorial reading, TradersWeek scores those sessions against the pretest map. Quick travel through 204 to 207 and 202 to 204 follows the low-volume-area rule. Rejection at 204 and at the top of 192 to 198 follows the support-resistance rule at a narrow point of control and at a high-volume area. The December 18 rally that stopped at 207.4 is scored as a test of the upper narrow point of control, not as a confirmed upside breakout.
What a later breakout still had to prove
A longer-horizon upside reading was described as unconfirmed until price broke out and held 207.4. On December 23, 2014 price sat inside a thin-volume band where near-term volatility was expected to stay high.
As an editorial reading, TradersWeek treats that unconfirmed state as the same pretest rule: a longer-horizon upside case is not scored as a confirmed breakout until the old narrow point of control is broken and held.
All readings on this track · 8 readings
- 2005Decaying volume bands as leftover auction inventory
- 2008Constructing equal-volume and open-interest auction zones
- 2010Constructing daily volume-profile breakout levels
- 2010Building volume profile maps for support and resistance
- 2015SPY volume profile as a support and breakout map
- 2016A three-layer sector map around a policy-meeting week
- 2017A three-part liquidity screen before a futures idea is executable
- 2020A two-gate liquidity filter before futures order selection