2010issue C0644-46
Building volume profile maps for support and resistance
Treat support and resistance as a construction task. Build a volume-at-price histogram first, keep only the high-participation peaks, and test those levels against the live tape.
- Finding daytrading support and resistance by scanning many intraday charts of the same stock is time-consuming, and some packages hide candle history beyond six months.
- A volume profile, also called price by volume, is a price-axis histogram of cumulative traded volume over a chosen lookback-window. It ranks levels by participation rather than by how a candle looks.
- Construction needs a lookback-window, a bar interval, and a candle-price-assignment that sends each bar's volume to its open, high, low, or close before the profile is summed.
- Prices with much larger accumulated volume than nearby prices are treated as more significant support and resistance, then checked against a contemporaneous five-minute candlestick chart.
Why candle scanning is a hard way to build levels
Finding daytrading support and resistance often means scanning many intraday charts of the same stock. That process is described as time-consuming.
Some charting packages do not show history beyond six months, so older candle-based levels can be hard to recover.
What a volume profile is
Volume profile, also called price by volume, plots cumulative volume at each price. It is treated as distinct from Market Profile because it omits the time component.
A volume profile is a price-axis histogram of cumulative traded volume over a chosen lookback. The map ranks levels by participation rather than by how a candle looks. Price by volume is another name for the same construction. It stresses stacking volume on price instead of on time.
Assemble the histogram before you name a level
A volume profile is built by summing shares traded at each price after three choices are fixed: the lookback-window, the bar interval, and the candle-price-assignment. The lookback-window is the historical span over which volume is accumulated at each price. Candle-price-assignment is the rule that sends each bar's volume to its open, high, low, or close before the profile is summed.
One construction assigned each five-minute bar's volume to that bar's high over six months, extracted price-level subtotals in a spreadsheet, and plotted them as a bar chart.
Only high-participation peaks become support and resistance
Support and resistance are prices where earlier concentrated trading is expected to slow, stall, or reverse a later move. Prices with much larger accumulated volume than nearby prices are treated as more significant support and resistance than those nearby low-volume prices.
Editorial interpretation: the nearby low-volume prices can remain on the histogram, but they do not become the levels you test.
Check the map against the tape
The finished profile can be checked against a contemporaneous five-minute candlestick chart to see whether high-volume prices line up with session support and resistance.
Volume profile can surface levels from more than six months earlier. In the described approach, multi-year history is available only at daily resolution.
SunTrust five-minute tape versus $24.33 and $24.11
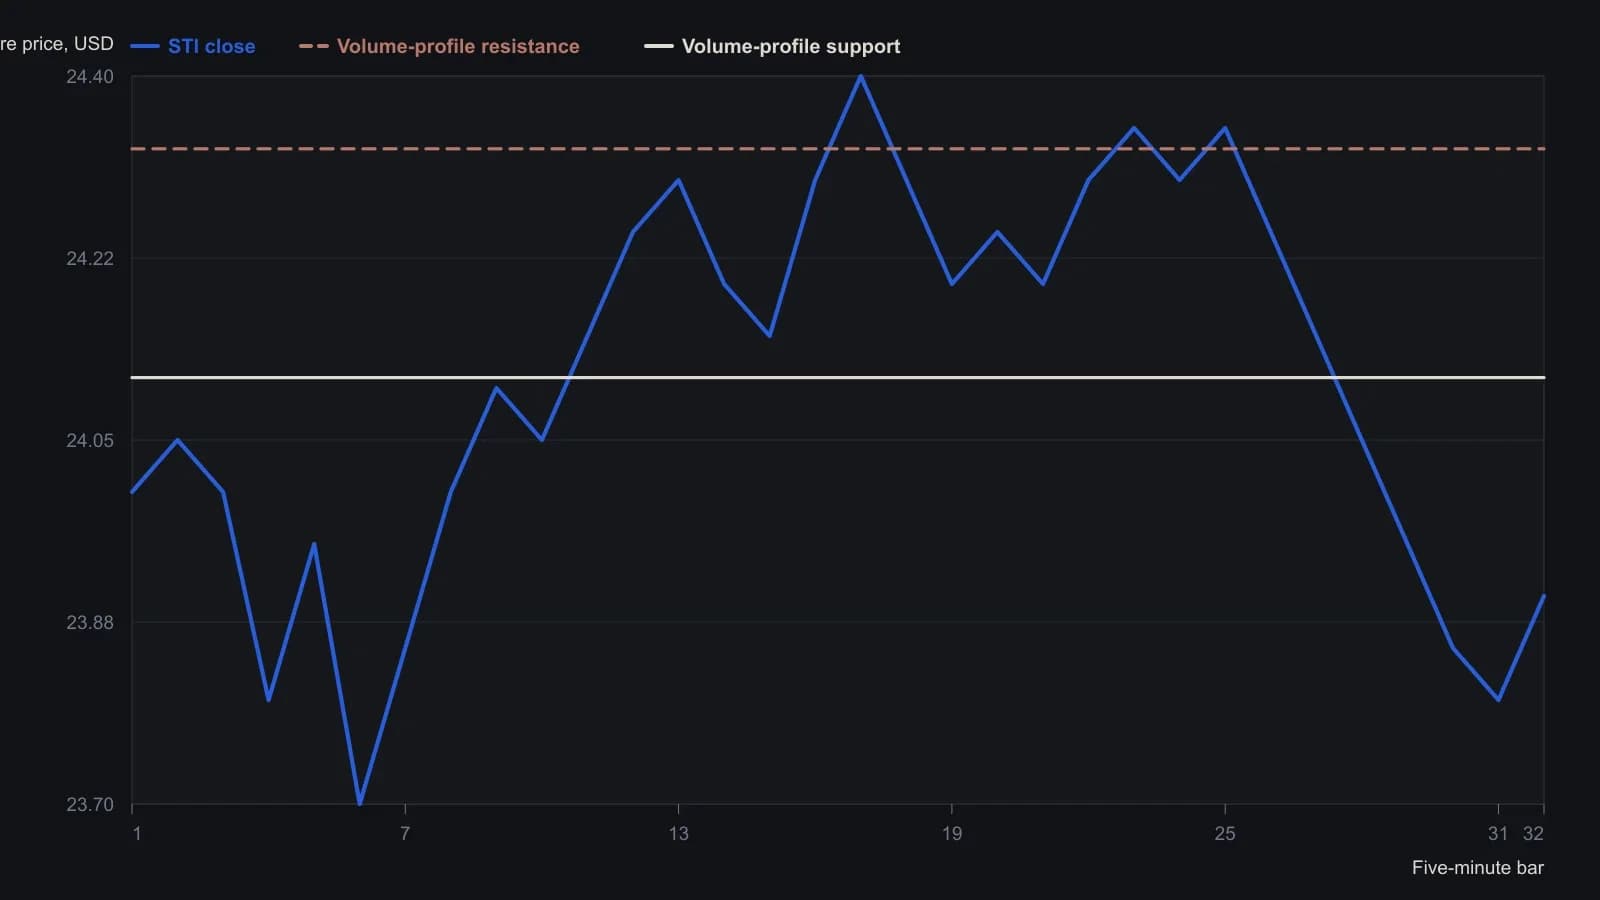
The source built the volume-at-price map from five-minute candle highs. The tape snapshot is timestamped 3:45 p.m. on 26 January 2010. Digitized closes are rounded to five cents because the raster does not support penny precision.
All readings on this track · 8 readings
- 2005Decaying volume bands as leftover auction inventory
- 2008Constructing equal-volume and open-interest auction zones
- 2010Constructing daily volume-profile breakout levels
- 2010Building volume profile maps for support and resistance
- 2015SPY volume profile as a support and breakout map
- 2016A three-layer sector map around a policy-meeting week
- 2017A three-part liquidity screen before a futures idea is executable
- 2020A two-gate liquidity filter before futures order selection