2020issue C0858
A two-gate liquidity filter before futures order selection
A 2020 board ranked listed futures by relative contract liquidity, then compared size and margin on a shared dollar range. The workflow is a pre-trade filter for executable orders, not a forecast of price.
- Relative contract liquidity multiplies an equal-dollar contract count, total open interest, and a volume factor so quieter books rank lower.
- Markets marked with one or zero activity dots are treated as low-activity books and less suitable for speculative execution.
- Equal-dollar contract counts and effective percent margin put listed markets on one three-year dollar scale before a size is chosen.
- Corn showed a 36.8 percent posted margin against an 89.5 percent effective margin, so posted margin and range-scaled margin are not interchangeable cost filters.
What the archive board measures
A liquidity filter is a pre-trade screen that keeps only futures with enough ranked activity to absorb a speculative order. Relative contract liquidity is a descending cross-market rank of how easily all listed contracts in a futures market can be bought or sold.
A relative futures-liquidity rank can be formed by multiplying an equal-dollar contract count, total open interest, and a volume factor. The construction is about order selection and implementation cost. It is not a price forecast.
First gate, rank the book
Open interest analysis uses outstanding contract positions as a size input when ranking how easily a market can be entered or exited. Volume profile uses traded volume, including a volume-based multiplier, to down-weight quiet books in a cross-market liquidity rank.
The volume factor is a multiplier of at least one that adjusts the liquidity rank for session volume versus a 5,000-contract benchmark. In the archive construction, that volume factor is the greater of 1 and an exponential of log volume divided by log 5000, then reduced by 2.
Equal-dollar contract counts are built from tick dollar value times the three-year maximum price excursion so listed markets share one dollar scale. The equal-dollar contract count is how many contracts of one market are needed to match another market on that shared three-year dollar-range scale.
Markets marked with one or zero activity dots are treated as low-activity books and less suitable for speculative execution.
Second gate, choose an implementable size
After thin books are set aside, size is compared on the shared dollar scale. Effective percent margin is posted margin dollars divided by the contract’s three-year dollar price range, expressed as a percent. In the archive, that figure is dollar margin divided by the three-year dollar range of the contract, then multiplied by 100.
Posted margin and range-scaled margin are not interchangeable cost filters. Corn showed a 36.8 percent posted margin against an 89.5 percent effective margin.
Equal-dollar contract counts on the August 2020 futures board
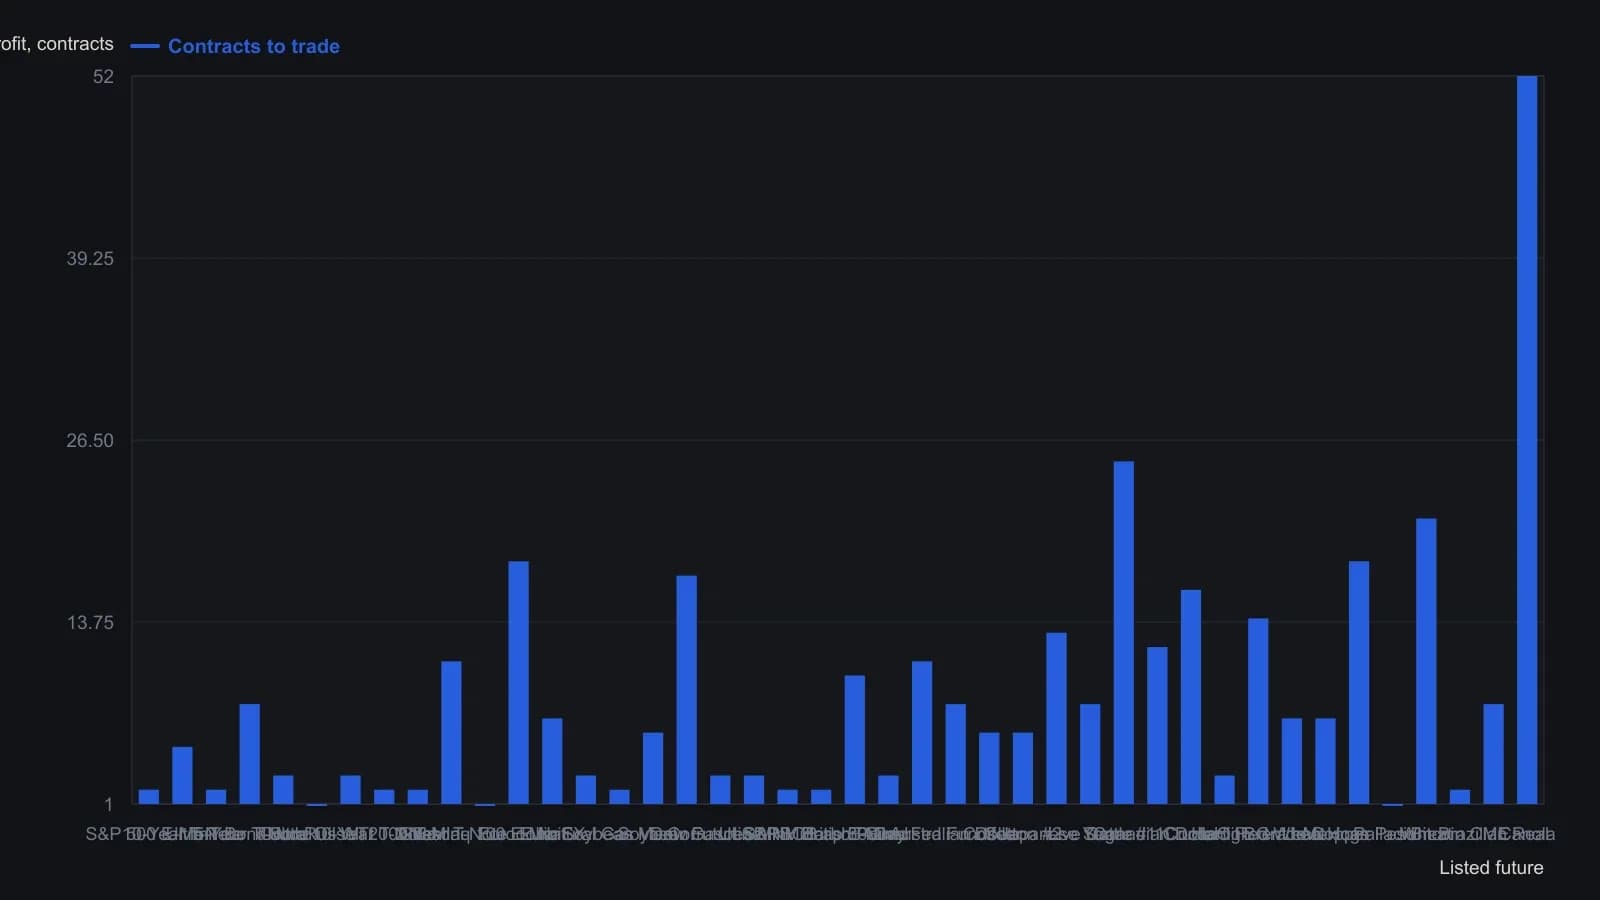
Contracts to trade equals tick dollar value times the three-year maximum price excursion. The board is an August 2020 snapshot; each figure is comparable only to others in this same column.
Read each column only against itself
Each column on the board is a proportional comparison and is meaningful only against other markets in that same column. In the 2020 snapshot the S&P 500 E-mini led the relative-liquidity rank, while several grains, metals, and bitcoin futures sat at the thin end.
For listed shares, period volume as a percent of shares outstanding is presented as a turnover-rate proxy for trading liquidity.
All readings on this track · 8 readings
- 2005Decaying volume bands as leftover auction inventory
- 2008Constructing equal-volume and open-interest auction zones
- 2010Constructing daily volume-profile breakout levels
- 2010Building volume profile maps for support and resistance
- 2015SPY volume profile as a support and breakout map
- 2016A three-layer sector map around a policy-meeting week
- 2017A three-part liquidity screen before a futures idea is executable
- 2020A two-gate liquidity filter before futures order selection