2017issue C1258
A three-part liquidity screen before a futures idea is executable
The archive ranked futures by multiplying point value, a three-year price-motion estimate, open interest, and a volume adjustment, then compared contracts on an equal-dollar scale. TradersWeek editorial reading: keep the idea untradeable until size, residual inventory, and turnover all clear.
- A liquidity filter ranks contracts by how readily they can be entered and exited, using point value, a multi-year price-range estimate, open interest, and a volume adjustment rather than chart pattern alone.
- Relative contract liquidity equals the equal-dollar contract count times total open interest times a volume factor, and is meaningful only against other contracts on the same scale.
- Volume profile is a turnover overlay on open interest, so a large inventory book is not treated as liquid if little is actually trading.
- In the December 2017 ranking, the S&P 500 E-Mini, the 10-year Treasury note, and WTI crude occupied the most liquid end of the list, while contracts with one or no liquidity dots were treated as harder to enter and exit.
Rank first, then decide whether size can be placed
The archive formed a futures liquidity rank by multiplying contract point value, a three-year maximum price-motion estimate, open interest, and a volume adjustment usually set between 1 and 4.
That construction is a liquidity filter: a pre-trade screen of how readily a contract can be entered and exited, using those inputs rather than chart pattern alone.
Inventory, turnover, and an equal-dollar scale
Open interest analysis reads outstanding contract inventory as a capacity input. Higher open interest, when combined with the equal-dollar contract count, supports a higher relative-liquidity rank.
Volume profile is a turnover overlay on that inventory. Thin or extreme volume is compressed or boosted with a volume factor so a large open-interest book is not treated as liquid if little is actually trading. The volume factor is the greater of 1 and exp(ln(volume) / ln(5000) - 2).
The equal-dollar contract count, which is also the contracts-to-trade figure, equals tick dollar value times the three-year maximum price excursion. Every entry in that column represents the same dollar exposure: the number of contracts of one market needed to match another market's dollar exposure.
Relative contract liquidity equals the equal-dollar contract count times total open interest times the volume factor. The score is meaningful only against other contracts on the same scale.
What the December 2017 list showed
In the December 2017 ranking, the S&P 500 E-Mini, the 10-year Treasury note, and WTI crude occupied the most liquid end of the list.
Contracts marked with one or no liquidity dots were treated as low-activity markets and therefore harder to enter and exit.
Contracts needed for equal-dollar profit, December 2017 futures
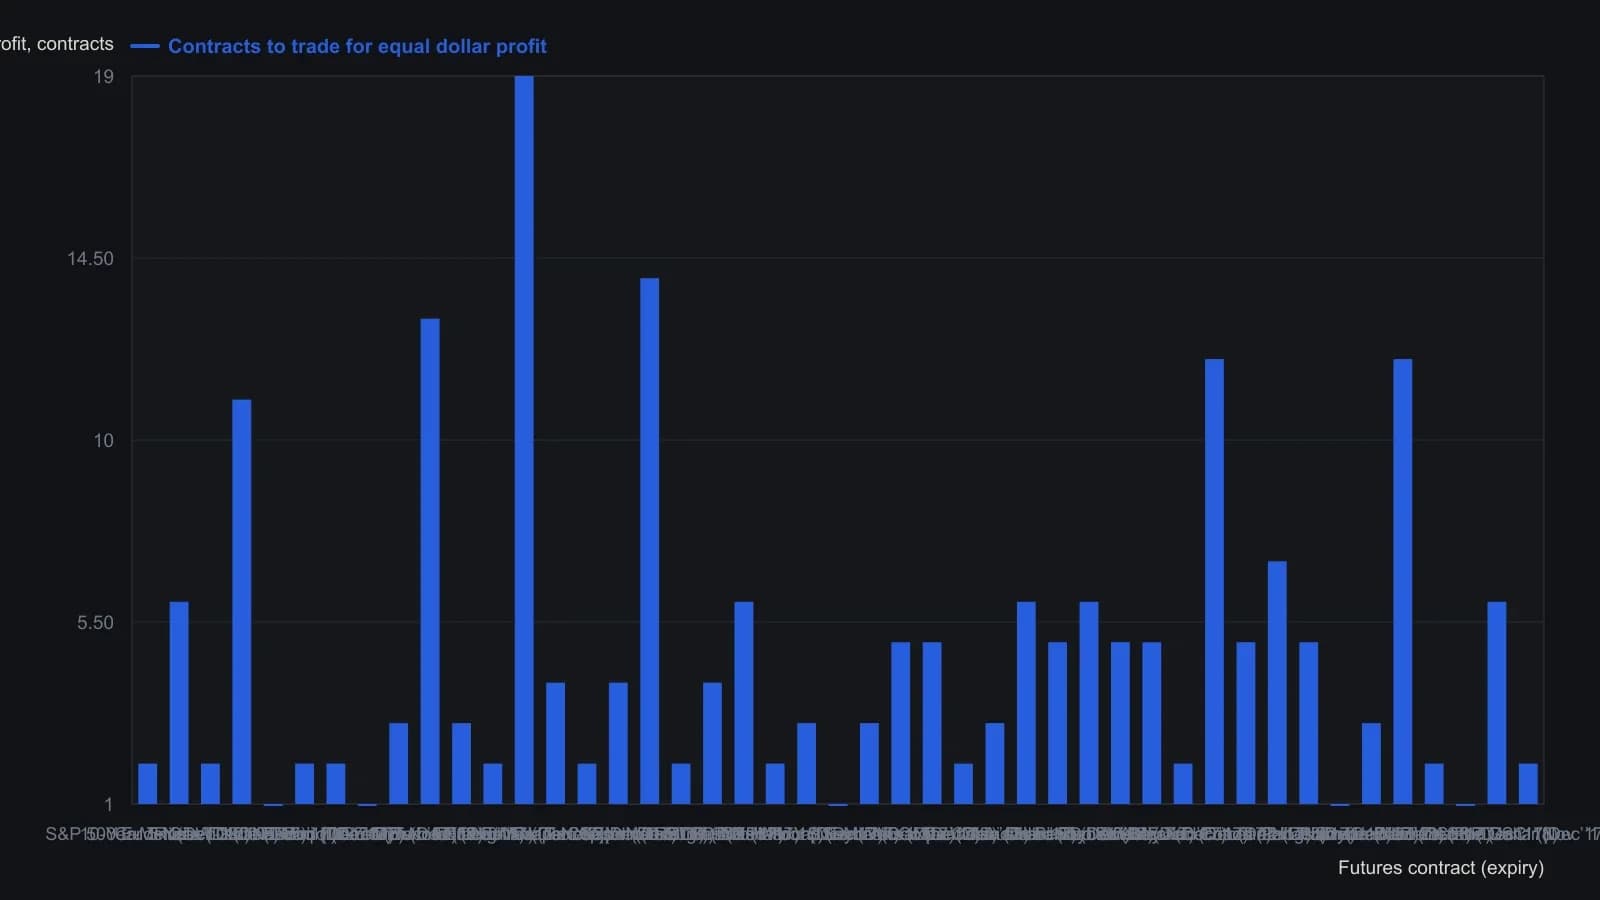
The source defines Contracts to Trade as tick dollar value times the three-year maximum price excursion, so every market is compared on an equal-dollar scale. Relative Contract Liquidity (the published dot ranking) is a separate product of that count, open interest, and a volume factor, and is not plotted here.
Margin and a listed-stock parallel
Effective percent margin equals margin dollars divided by the three-year range of contract dollar value, then multiplied by 100, so posted margin can be compared with the capital that historically moved.
For listed stocks, share turnover uses period volume as a percentage of shares outstanding as a turnover proxy for trading liquidity, a parallel to futures open interest and volume.
All readings on this track · 8 readings
- 2005Decaying volume bands as leftover auction inventory
- 2008Constructing equal-volume and open-interest auction zones
- 2010Constructing daily volume-profile breakout levels
- 2010Building volume profile maps for support and resistance
- 2015SPY volume profile as a support and breakout map
- 2016A three-layer sector map around a policy-meeting week
- 2017A three-part liquidity screen before a futures idea is executable
- 2020A two-gate liquidity filter before futures order selection