2002issue C111-4
Six-week reversal candles, next-week entry, and a break-even stop
On a weekly chart, a new six-week extreme is treated as a trade condition only when that week closes against the extreme. Entry then waits for the following week to trade through last week's close by a small increment, after which a break-even-stop can rewrite remaining risk once a stated gain threshold is reached.
- A six-week-bullish-low is a weekly bar that prints a new six-week low and still closes above its open.
- A six-week-bearish-high is a weekly bar that prints a new six-week high and still closes below its open, and a narrow-range week can still qualify if it posts that high and closes below its open.
- The next-week-close-trigger waits until the week after the signal and fires only when price trades through last week's close by a small increment.
- A break-even-stop is moved to the entry price after a stated gain threshold so further adverse movement is bounded at flat.
When a six-week extreme counts
On a weekly chart, a new six-week low is treated as a bullish condition only when that week closes above its open. That pairing is the six-week-bullish-low: a weekly bar that prints a new six-week low and still closes above its open.
On a weekly chart, a new six-week high is treated as a bearish condition only when that week closes below its open. That pairing is the six-week-bearish-high: a weekly bar that prints a new six-week high and still closes below its open.
A narrow-range week can still qualify as a six-week-bearish-high if it posts the new high and closes below its open. The historical workflow does not treat the extreme alone as an entry.
Candle-body-and-shadow
Weekly candlesticks carry the same open-high-low-close points as bar charts, but make the close-versus-open relationship and shadow length readable at a glance. Candle-body-and-shadow is the body plus upper and lower tails used to read close-versus-open and the location of the six-week extreme without reconstructing a thin bar.
A long lower tail on a six-week-low candle is read as extra bullish structure inside the same weekly open-high-low-close bar.
A long upper shadow that sets the six-week high, together with a close below the open, is the weekly condition used to arm a short for the next week.
The next-week-close-trigger
After a bullish signal week, the entry rule waits until the following week and buys only after price trades above last week's close by a small increment. After a bearish signal week, the entry rule waits until the following week and sells only after price trades below last week's close by a small increment.
That delayed entry is the next-week-close-trigger: a delayed entry that waits until the week after the signal and fires only when price trades through last week's close by a small increment.
When a sector vehicle posts a six-week extreme, the same weekly rule can be applied to a constituent stock instead of the sector vehicle itself.
IYD weekly prices through the 2002 six-week reversals
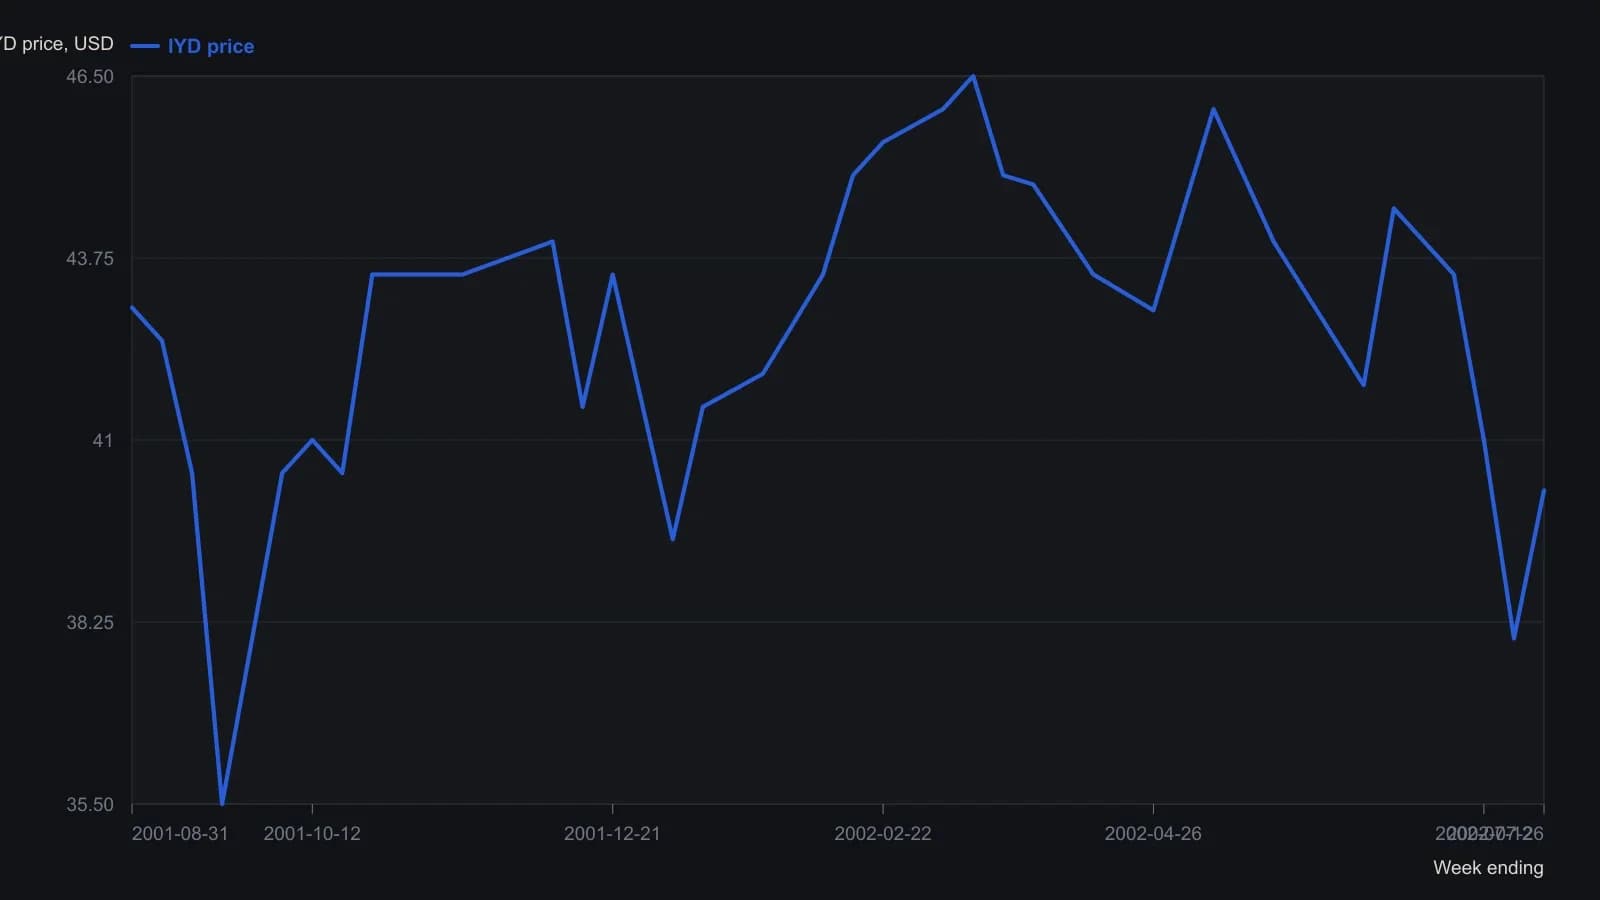
Visual weekly closes are read to the nearest half dollar from a 1-point price scale (32–47). 44.86 is the next-week short fill, not necessarily that week’s close. 42.96 and 41.83 are exact closes from the article. The last week uses the printed header 37.30/40.25/35.78/40.24.
Break-even-stop after a stated gain
A described options money-management rule moves the stop to break even after a gain of 25 percent or more. A break-even-stop is a protective stop moved to the entry price after a stated gain threshold so further adverse movement is bounded at flat.
Editorial: once that threshold is reached, remaining risk is rewritten at the entry price.
All readings on this track · 9 readings
- 1986The stop, the size, and the acceptable loss as one pre-entry gate
- 1988Opening range breakout, stretch preference, and timed stops
- 2002Six-week reversal candles, next-week entry, and a break-even stop
- 2013Hard stops and small bets to keep a portfolio alive
- 2014Bounding losses with stops, leverage and break-even exits
- 2016Process-first swing trading and the break-even stop
- 2018Credit-spread risk budget beyond support
- 2019Break-even stops require a new invalidation
- 2020Momentum scale-in and midpoint break-even stops