2020issue C0160-61
Momentum scale-in and midpoint break-even stops
A smaller first probe, an add two dollars above that fill, and a break-even stop at the midpoint of the two entries form one holding-period sequence. Added size is reserved for trades already moving in the intended direction.
- Keep the opening quantity smaller so a failed first attempt incurs a smaller stop-loss cost.
- In the worked case the second fill is placed two dollars above the first fill, so a 24.50 opening fill implies an add at 26.50.
- After the add fills, a break-even stop at the midpoint of the two entries, 25.50 in the same example, bounds the combined position.
- Share size and scale-in distance are the variables to test. Early tests of the procedure failed when size was added too soon after the first fill.
One sequence over the holding period
The archive case presents a momentum continuation as one sequence. A momentum strategy, in the terms used here, is a continuation sequence that treats the first fill, the add, and the protective exit as one testable procedure over the holding period.
More than one entry is used so a single fill does not have to be perfectly timed for the idea to remain valid. Added size is reserved for trades that are already moving in the intended direction rather than for the first probe.
IVE/IVW value-to-growth ETF ratio, mid-2000 through November 2019
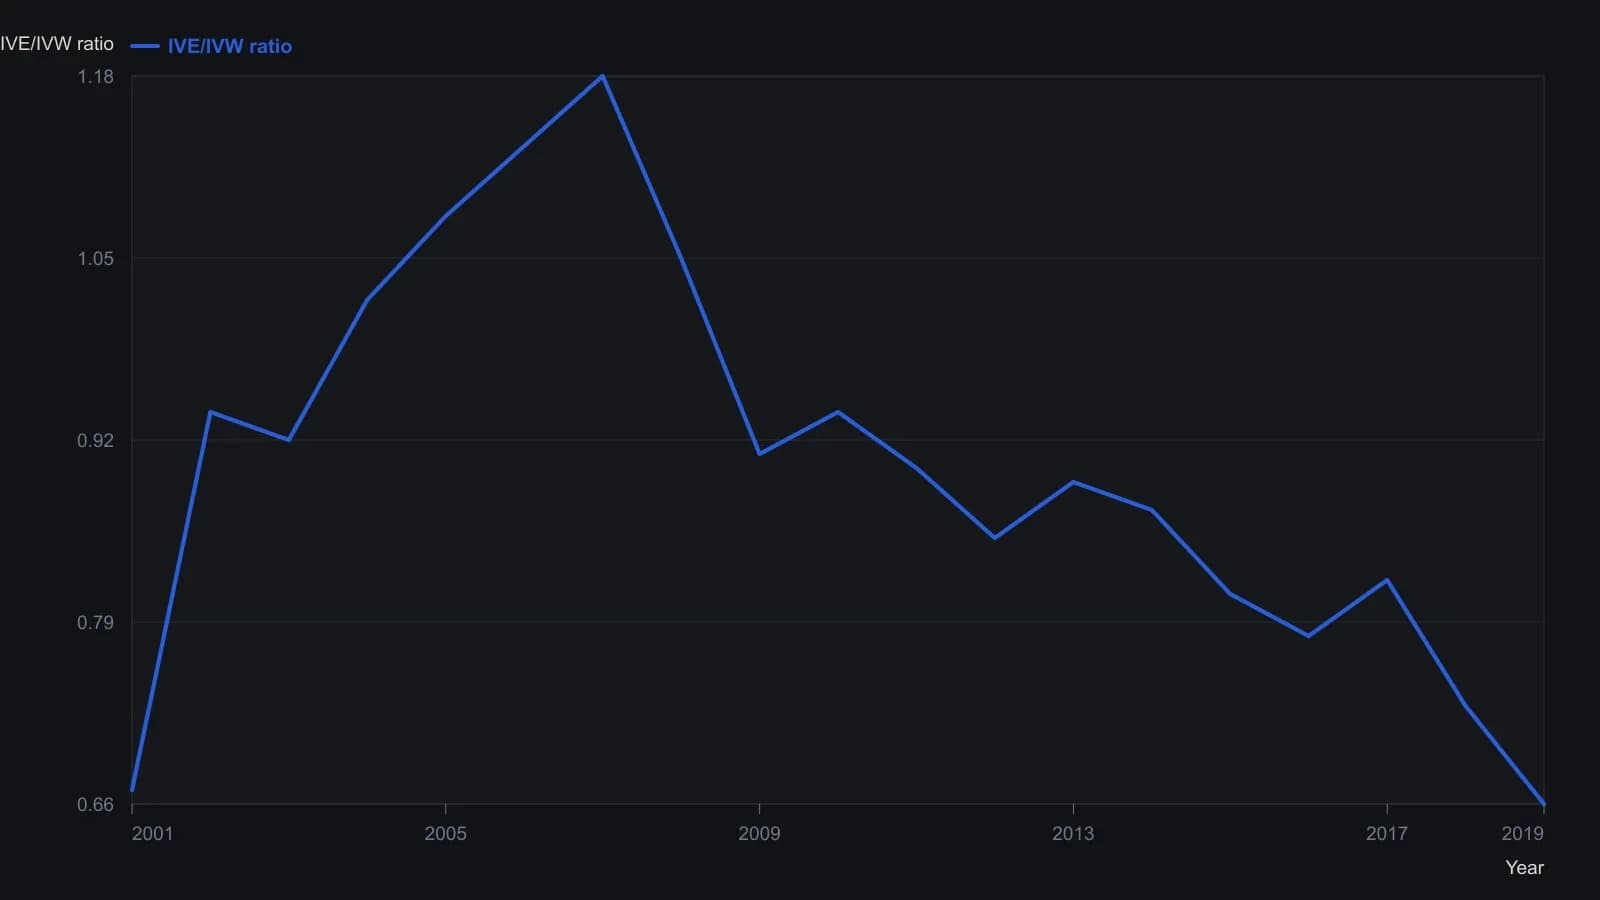
Digitized from the printed line chart. The source names a late-April 2007 peak and a downslope through October/November 2019 but does not publish the series. Year-end samples keep the point count well under 60.
A smaller first probe
The opening quantity is kept smaller so a failed first attempt incurs a smaller stop-loss cost. That first-probe size is the reduced opening quantity used so a failed first fill costs less while later adds can still build a full position.
Initial practice is described as using fewer than 100 shares. Share size remains one of the variables to test.
The add and the midpoint stop
Scale-in position means adding quantity only after the first probe is already working, so later fills enlarge a confirmed move rather than the opening guess. In the worked case, the second fill is placed two dollars above the first fill, so a 24.50 opening fill implies an add at 26.50.
After that add fills, a break-even stop is placed at the midpoint of the two entries, which is 25.50 in the same example. That break-even stop is a protective exit placed at the midpoint of the first and second fills so the combined position is bounded once the add is on.
Scale-in distance as a test variable
Scale-in distance is the required gap between the first fill and the add. Too tight and ordinary pullbacks stop the trade. Too wide and the add arrives near a short-term high.
Adding only one dollar above the first fill is described as leaving the combined position exposed to an ordinary pullback that hits the midpoint stop. Waiting four or five points before adding is described as raising the chance of buying near a local high and then being taken out at break-even.
Early tests of the procedure failed when size was added too soon after the first fill. Share size and scale-in distance are the variables to test.
All readings on this track · 9 readings
- 1986The stop, the size, and the acceptable loss as one pre-entry gate
- 1988Opening range breakout, stretch preference, and timed stops
- 2002Six-week reversal candles, next-week entry, and a break-even stop
- 2013Hard stops and small bets to keep a portfolio alive
- 2014Bounding losses with stops, leverage and break-even exits
- 2016Process-first swing trading and the break-even stop
- 2018Credit-spread risk budget beyond support
- 2019Break-even stops require a new invalidation
- 2020Momentum scale-in and midpoint break-even stops