2019issue C0436-37
Break-even stops require a new invalidation
The archive presents an early break-even stop as a subjective way to avoid a small loss, and as a move that can cut off a planned profit path. A later tighter stop is treated as justified only when new structure would invalidate the trade idea if broken.
- Some inexperienced traders are described as moving a stop-loss to break-even as soon as a trade shows a profit, to avoid a small loss rather than because a new technical invalidation has formed.
- Moving a stop to break-even with no technical reason is presented as injecting subjectivity into risk decisions and as a way a planned profit path can be cut off.
- Tightening the same long is treated as technically justified after a higher low and a break of the prior high, because a break of that higher low would challenge the trade idea.
- In the equity-index futures illustration, the justified stop adjustment sits below the following day's candle, not back at the entry used for the original risk-reward ratio.
A profit does not create a new invalidation
A stop-loss is a pre-planned exit placed beyond the price that would invalidate the trade idea and bound the loss before the position is opened. A break-even stop is a stop relocated to the entry so the remaining outcome is a scratch rather than the original planned loss.
Some inexperienced traders are described as moving a stop-loss to break-even as soon as a trade shows a profit, to avoid a small loss rather than because a new technical invalidation has formed. Technical invalidation is a later price structure that would make the original thesis no longer valid and can justify a tighter stop.
Moving a stop to break-even with no technical reason is presented as injecting subjectivity into risk decisions and as a way a planned profit path can be cut off.
Selling the same support that justified the long
A worked long at 150.00 with a 149.00 stop and a 152.00 target shows an early push to 150.70, a break-even stop hit near 149.93, and a later move to the original 152.00 objective after the position was already out.
Relocating that stop to the 150.00 entry is framed as selling at the same support area that justified the long, which conflicts with buying support and selling resistance.
When a higher low can justify a tighter stop
Tightening the same long is treated as technically justified after a higher low at 150.20 and a break of the prior 150.70 high, because a break of that higher low would challenge the trade idea. A higher low is a subsequent trough above the prior trough, used here as a possible new place to trail a long stop.
The planned risk-reward ratio stays at the original distances
An equity-index futures illustration places a long at 2,471 with a stop at 2,316 and a target at 2,729, described as just under a 1-to-2 risk-reward ratio. The risk-reward ratio is the planned target distance relative to the original stop distance, used to judge whether a setup is worth taking before entry.
In that illustration the justified stop adjustment is below the following day's candle at 2,397, not back to the 2,471 entry.
The same test on any timeframe
The same break-even-stop critique is presented as timeframe-independent. The logic would be unchanged on a 60-minute chart.
E-mini S&P 500 entry, stops, and target in the daily example
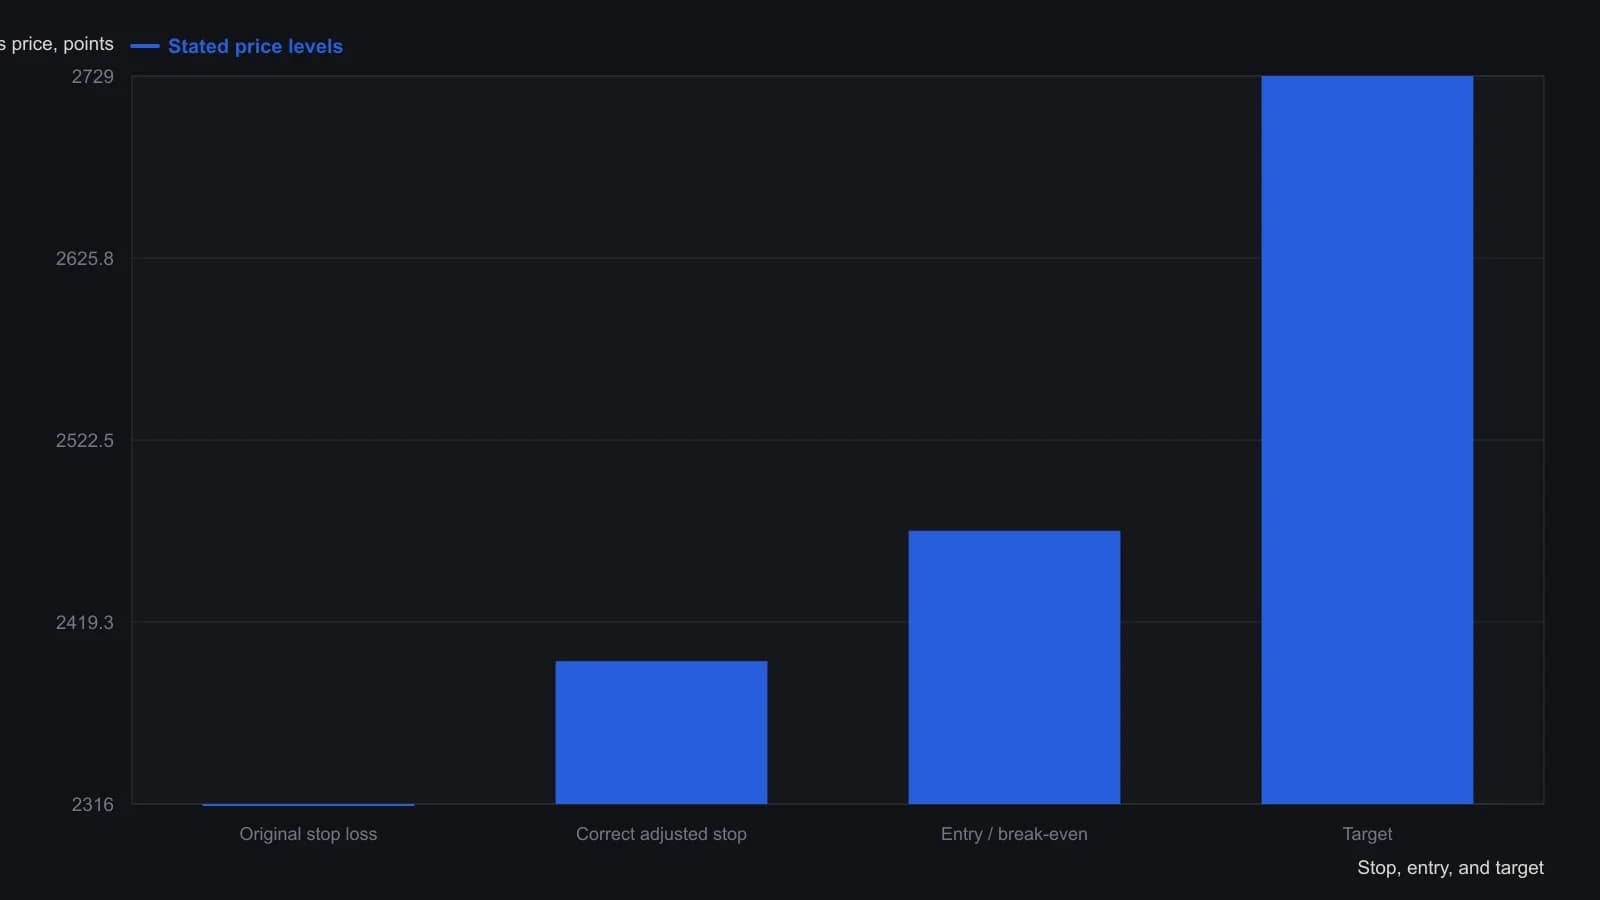
The author frames this as a hypothetical daily long: buy the next open after the engulfing at 2471, original stop under that candle at 2316, target 2729, called just under a 1:2 reward-to-risk. He says the same structure test would apply on a 60-minute chart.
All readings on this track · 9 readings
- 1986The stop, the size, and the acceptable loss as one pre-entry gate
- 1988Opening range breakout, stretch preference, and timed stops
- 2002Six-week reversal candles, next-week entry, and a break-even stop
- 2013Hard stops and small bets to keep a portfolio alive
- 2014Bounding losses with stops, leverage and break-even exits
- 2016Process-first swing trading and the break-even stop
- 2018Credit-spread risk budget beyond support
- 2019Break-even stops require a new invalidation
- 2020Momentum scale-in and midpoint break-even stops