2018issue C0522-23
Credit-spread risk budget beyond support
A bull-put-credit-spread takes a net credit as its largest gain while the largest loss is typically much wider. The archive workflow sells time-premium when implied volatility is already rich, then places the break-even-exit beyond chart-support so an ordinary retest is not a stop-out.
- A bull-put-credit-spread sells a higher-strike put and buys a lower-strike put. The net credit is the largest possible gain, and a stop or other risk plan is treated as required because the largest loss typically exceeds that gain by a wide margin.
- Selling is preferred when the implied-volatility-backdrop sits at the high end of its own history, so more time-premium is embedded. An out-of-the-money-short is the default so the credit is all time premium; an in-the-money short is allowed but is not the default.
- A nonbinding expiration-window of 21 to 45 days remaining is offered to balance collectible premium against how slowly longer-dated options lose time value.
- The planned break-even-exit sits beyond obvious chart-support. In the numerical illustration, 1,500 of maximum risk against 500 of maximum profit means three later full winners are needed after one unmanaged full loss.
The credit is the cap, not the risk
A bull put vertical, here called a bull-put-credit-spread, is formed by selling a higher-strike put and buying a lower-strike put. The largest possible gain equals the net credit.
The largest possible loss on a credit spread typically exceeds the largest possible gain by a wide margin, which is why a stop or other risk plan is treated as required.
Editorial reading: treat the spread as a risk-budget and exit-geometry problem first. Collect time-premium only when the implied-volatility-backdrop already inflates the credit, then place the break-even-exit past visible chart-support so an ordinary retest cannot convert one limited-credit trade into a hole that needs several later full winners to fill.
Collect time premium only when it is already rich
Implied volatility at the high end of its historical range is presented as the preferred implied-volatility-backdrop for selling a credit spread, because more time-premium is then embedded in the options.
An out-of-the-money-short is preferred so the sold option is all time-premium. An in-the-money short option inside a credit spread is allowed but is not the default.
A nonbinding expiration-window of 21 to 45 days remaining is offered to balance collectible premium against how slowly longer-dated options lose time value.
Place the break-even exit beyond visible support
For a bull-put-credit-spread, the planned exit or adjustment price is to sit beyond an obvious chart-support level so a test of that level is treated as ordinary retesting rather than a reason to stop out.
In the hypothetical six-lot IBB example, March 100 puts sold at 1.10 against March 95 puts bought at 0.55 produce a 99.45 break-even that sits below the 100.68 support marked on the chart.
IBB March 100/95 bull put credit-spread payoff at expiration
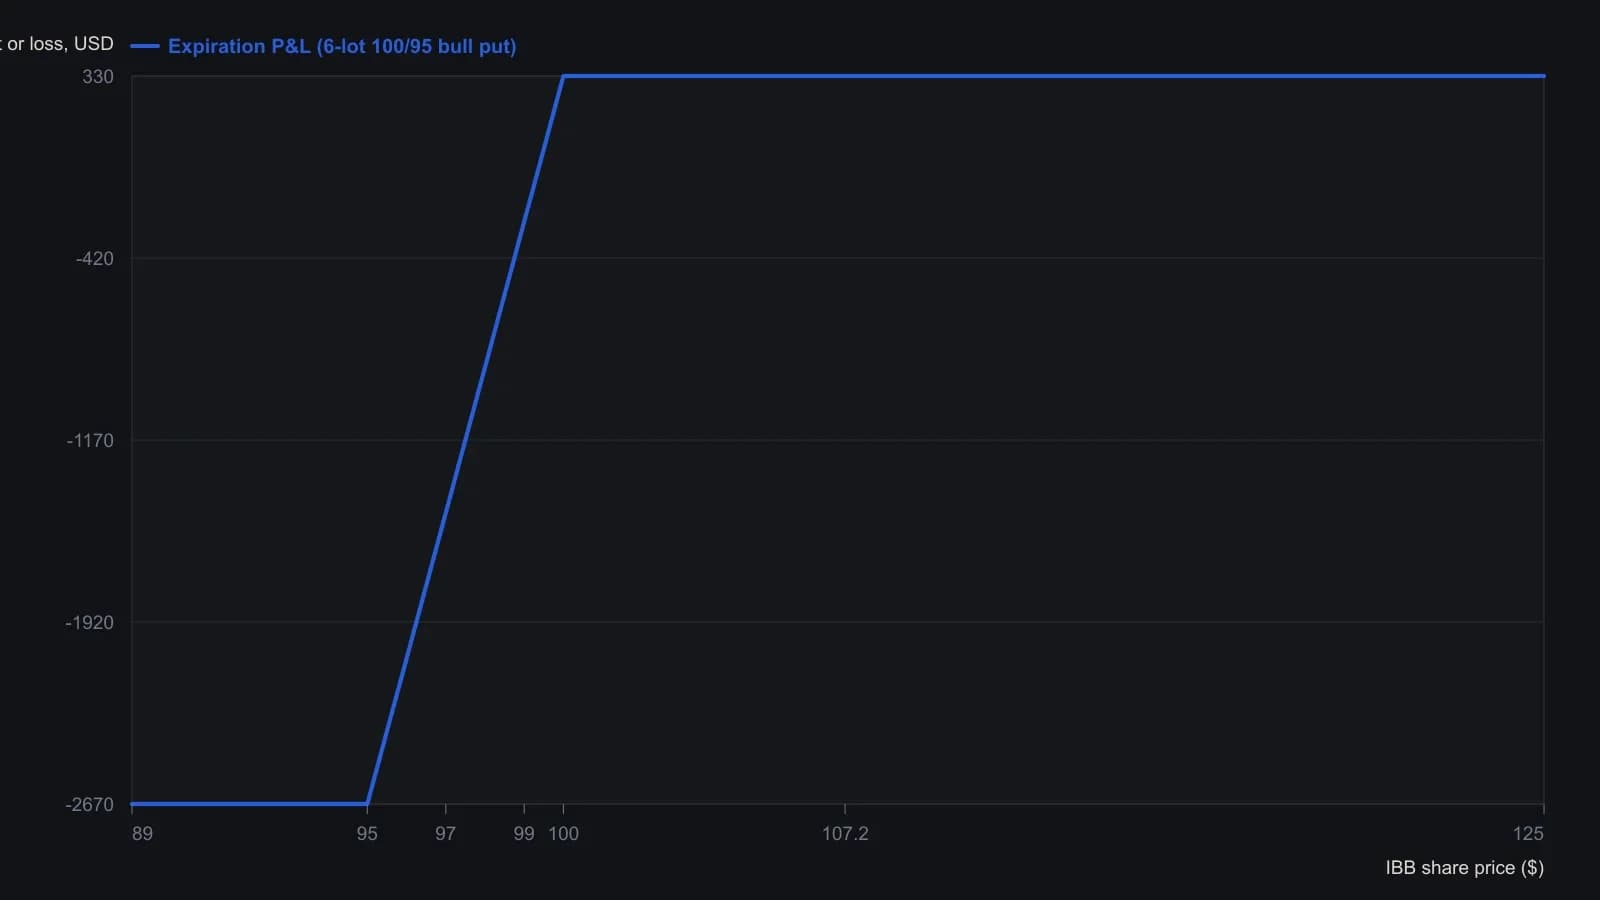
Payoff is at the 16 March 2018 expiration printed on the source overlay. The source also drew 31-, 21- and 11-day curves; those readings are not restated because they were never given as numbers.
All readings on this track · 9 readings
- 1986The stop, the size, and the acceptable loss as one pre-entry gate
- 1988Opening range breakout, stretch preference, and timed stops
- 2002Six-week reversal candles, next-week entry, and a break-even stop
- 2013Hard stops and small bets to keep a portfolio alive
- 2014Bounding losses with stops, leverage and break-even exits
- 2016Process-first swing trading and the break-even stop
- 2018Credit-spread risk budget beyond support
- 2019Break-even stops require a new invalidation
- 2020Momentum scale-in and midpoint break-even stops