2016issue C0517-20
Session-gated moving-average entry construction
Archive construction marks regular-session hours so the open can later constrain coded rules, writes entry, gain-taking, and loss-exit as one strategy, and adds a simple moving average last. Lookback length is the main overlay control. A tighter linear-regression curve fit is a different goal from executable rules.
- A closer mathematical fit to price is not the same construction goal as writing executable entry and exit rules.
- Color regular-session and overnight bars differently, and place vertical dividers at the night-to-day and day-to-night boundaries, so session state is readable as a filter.
- Chart overlays do not generate entries. Only an explicit buy-and-sell recipe produces signals.
- On a simple moving average, length is the main construction control. A length of 15 turns more slowly than a length of 5.
An editorial construction order
Editorial note: TradersWeek reads the archive workflow as a build order. Lock the hours that may generate signals, write entry, target, and stop as one procedure, and treat moving-average length as a forecast smoother rather than as the tightest curve through the bars.
Mark the open as a session filter
Regular-session and overnight bars can be colored differently so the open is visible at a glance. A worked example treats the regular session as 6:30 to 13:15 Pacific time.
Vertical dividers can mark the night-to-day and day-to-night boundaries so session state is readable as a filter. Session identification is meant to become a constraint inside later coded rules, not only a chart annotation.
Write one strategy, not an indicator signal
Chart overlays do not generate entries. Only an explicit buy-and-sell recipe produces signals.
A complete strategy statement specifies when to enter, when to take a gain if the trade is right, and when to exit if the trade is wrong. An indicator is a curve, line, or mark overlaid on a chart and does not issue buy or sell commands.
Choose length for smoothness, not a tighter fit
A closer mathematical fit to price is not the same construction goal as writing executable entry and exit rules. On the same series, a simple moving average is smoother and looser, while a linear-regression curve fit tracks the bars more tightly.
A linear-regression line can be drawn over a chosen bar count, including a 300-bar example. Using fewer bars concentrates the fit on more recent data.
A single-line simple moving average can take price, length, and displacement as input values, with length as the main construction control. A worked example uses a length of 9. That lookback length is the number of bars sent into the average. A length of 15 yields a smoother, slower-turning average than a length of 5, which tracks price more closely.
Weekly Dow: 9-week SMA versus linear-regression curve
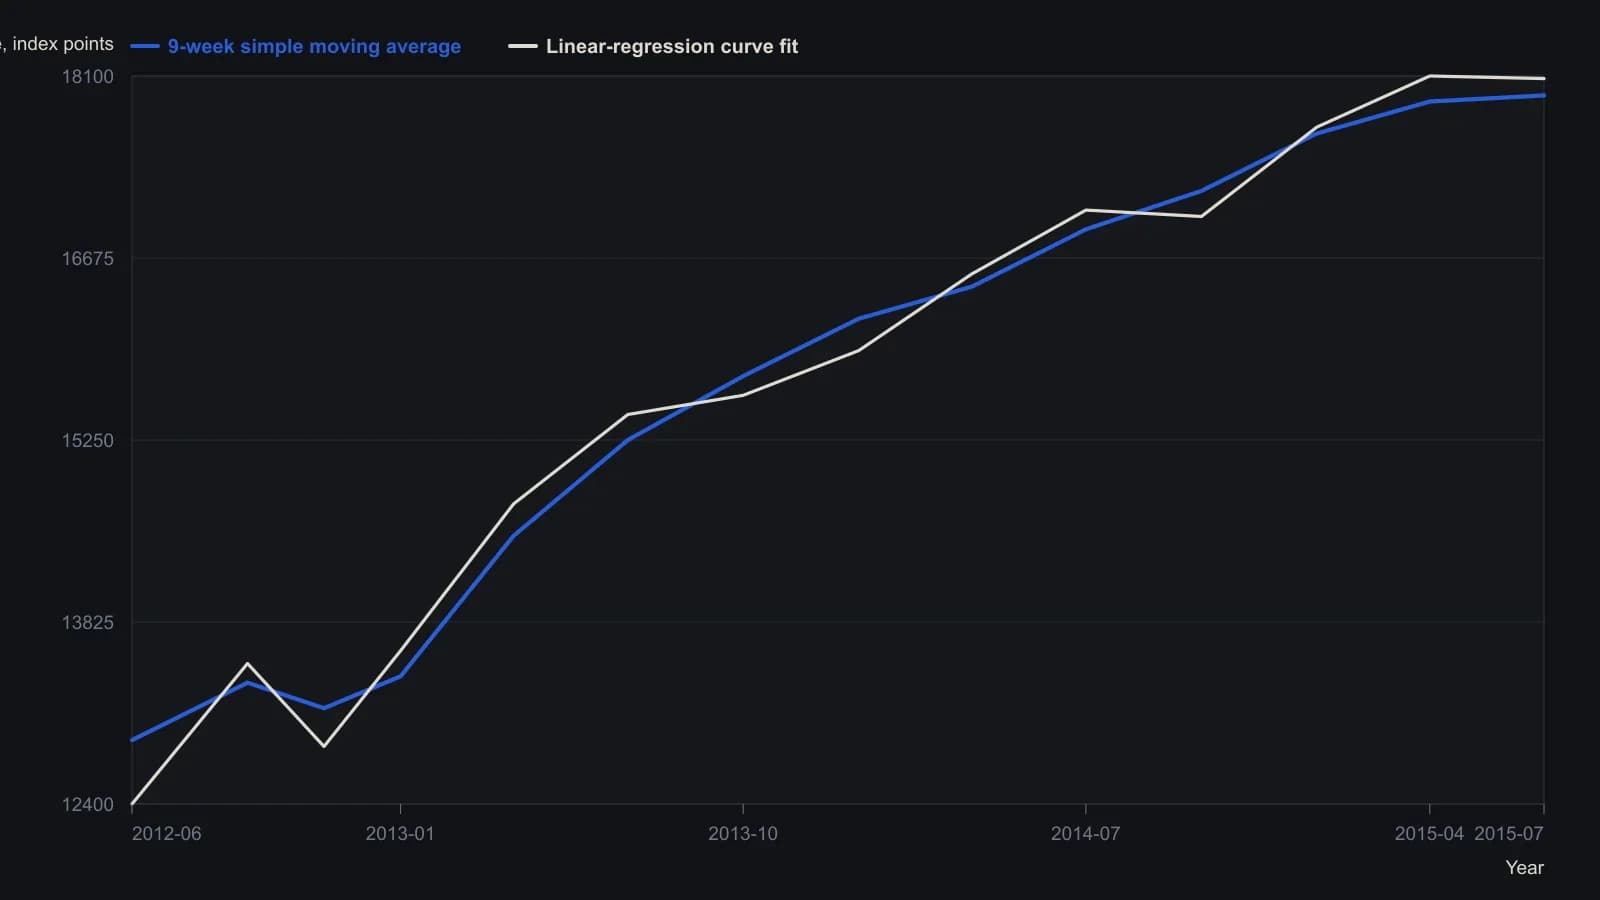
Platform header fixes the moving average at Close, length 9, displace 0. Digitized points are approximate to the nearest 50 index points except that final SMA print. The visible window runs from mid-2012 through mid-2015; year ticks on the axis were used to place the x values.
All readings on this track · 18 readings
- 1990Constructing a second-hour session residual exponential index
- 2000Treat an open limit book as an execution filter
- 2002Constructing a long, short, or flat pre-trade checklist
- 2003Session-window trims for mechanical day-system evaluation
- 2004Overnight session entry rules after regular hours
- 2005Overnight and regular session execution in Nasdaq 100 names
- 2006The intraday workspace as a combined decision procedure
- 2006Same-session trading needs presence and next-signal rules
- 2007Session filters for moving-average entry rules
- 2008Related-market checklist, session filter, and ATR-scaled stop
- 2008After-hours session regimes and the next-day close
- 2008Evaluating a next-open entry after one-day corrections
- 2010Session range share: currency futures versus the mini index
- 2011Dollar travel, afternoon sessions, and a 1:2 first-loss bound in equity-index futures
- 2012Last-hour volume breaks with a first-hour exit
- 2013Same-session and multi-session trades as one rule-based procedure
- 2015Session clock bars from public quote feeds
- 2016Session-gated moving-average entry construction