2008issue C111-4
When monthly wave counts split, freeze the ABC and Fibonacci brackets
A two-index falsification drill for monthly Elliott-wave labels: freeze the ABC and Fibonacci boxes first, then let a break of wave A, a too-short correction clock, or a miss of the lesser-degree fourth-wave range kill the milder count.
- When one monthly benchmark is labeled a finished fifth wave and another is still in wave B, freeze the ABC and Fibonacci boxes before choosing a count.
- A wave-C break below the wave-A low invalidates a contained ABC and implies a far deeper contraction.
- A completed ABC is expected to finish inside the lesser-degree fourth-wave box; a too-short clock can reject an early finish.
- Wave-alternation and a failed-c-wave keep impulse and correction labels testable rather than decorative.
A two-index starting point
Elliott-wave is a labeling of impulse and corrective swings that turns a completed five-wave rise into a testable next-leg hypothesis. An abc-correction is a three-swing countertrend structure expected to finish inside the prior fourth wave of lesser degree. Fibonacci-retracement means ratio levels drawn across a completed impulse or ABC range to mark candidate termination prices.
The archive case compared two monthly benchmarks that did not share the same completed-fifth label. Editorial reading: treat that split as a falsification drill, not as a vote. Freeze the ABC and Fibonacci boxes first. Then let a break of wave A, a too-short correction clock, or a miss of the lesser-degree fourth-wave range kill the milder count.
What the two monthly counts actually said
On the monthly S&P 500 count, wave B was labeled as high as or higher than wave 5, so wave C was allowed to finish at any of three Fibonacci ratio levels rather than at a single price. That S&P 500 count treated a wave-C break below the wave-A low as the condition that would invalidate a contained ABC and imply a far deeper contraction.
The monthly DJIA count differed by labeling a completed fifth wave, which implied an ABC into the prior fourth-wave box between 11905.51 and 7432.44. Inside that DJIA box a 61.8% Fibonacci retracement was marked at 10196.79. A 31 January 2008 DJIA low at 11517 was cited as a reading some treated as a finished correction inside that fourth-wave zone. The case rejected that reading because the elapsed time was too short for a major ABC.
Freeze the boxes, then apply the kill rules
The stated Elliott checklist required a completed ABC to terminate inside the fourth wave of lesser degree. That lesser-degree-fourth-wave is the inherited price box from the previous fourth wave, used as the expected landing zone for a completed ABC. A major ABC was described as typically retracing 38.2% of the preceding five-wave advance.
Once those boxes are frozen, three archive conditions can kill the milder count. First, a wave-C break below the wave-A low ends a contained ABC and implies a far deeper contraction. Second, a correction clock that is too short, as with the 31 January 2008 DJIA low at 11517, rejects a claim that the ABC has already finished inside the fourth-wave zone. Third, a completed ABC that misses the lesser-degree fourth-wave range fails the checklist landing-zone test.
Monthly S&P 500 ABC count with frozen Fibonacci brackets
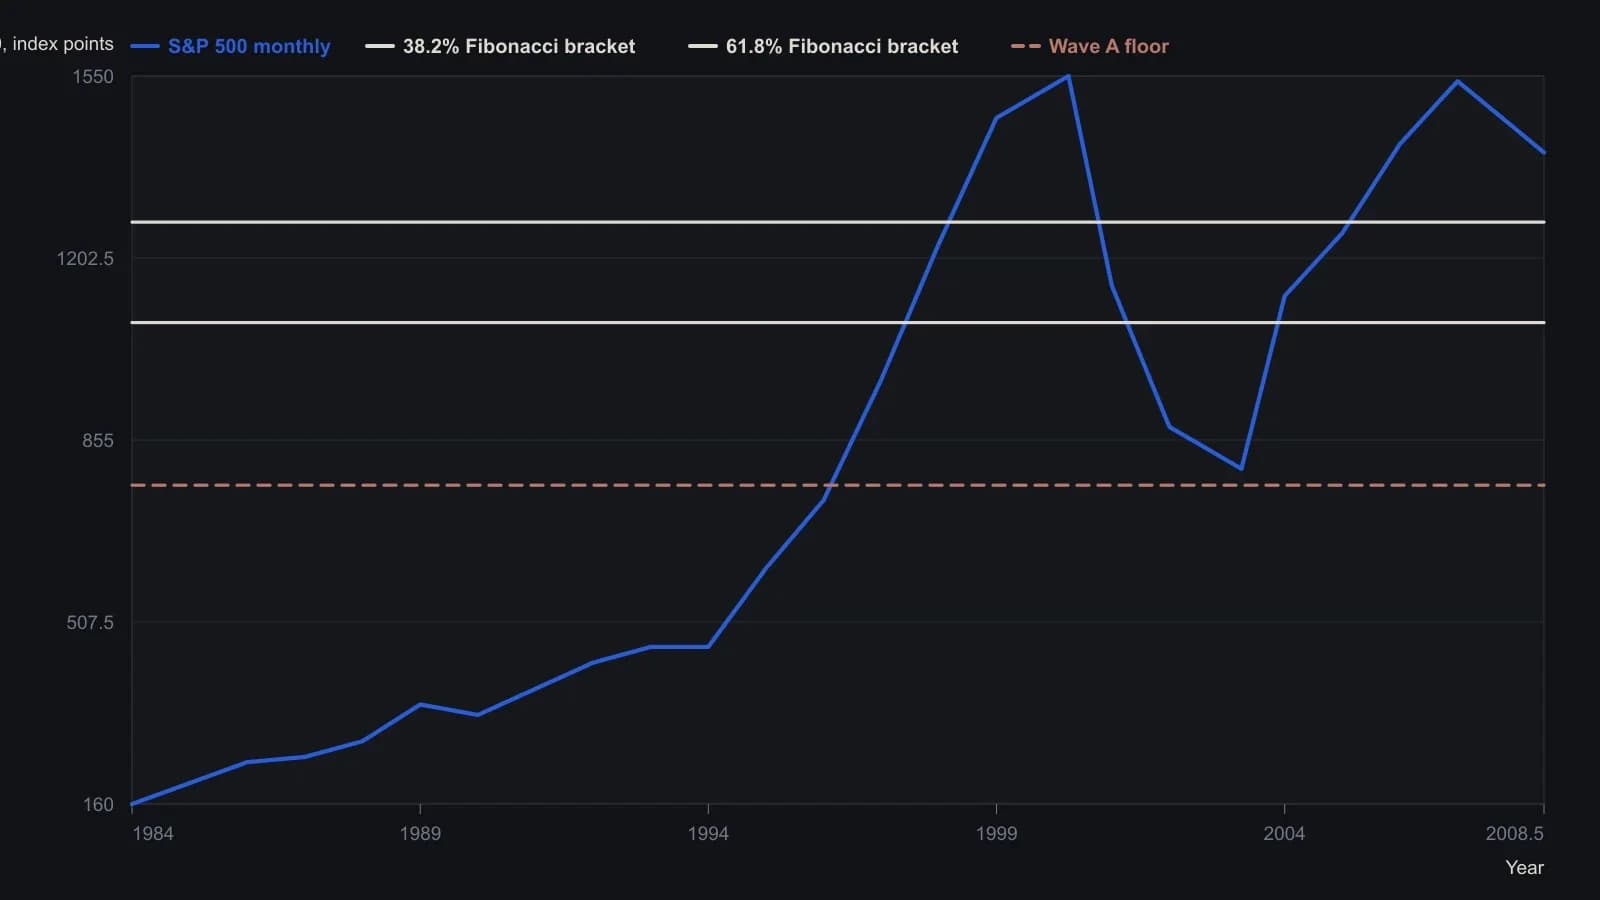
The author’s hand-drawn wave-C stroke is a forecast, not a print, and is left off. Prices along the path are digitised to the nearest 10 index points, as fine as the 0–1634 monthly raster will support. The 50 percent label on the source page is damaged in the extract (it prints as 175.0916) and is omitted.
Checklist rules that keep the labels testable
The same checklist required waves 2 and 4 to alternate in complexity: a simple second wave implied a complex fourth wave, and the reverse. That is wave-alternation, the requirement that the second and fourth waves of an impulse differ in complexity.
Impulse rules in that checklist required wave 3 to exceed wave 1, with wave 5 matching wave 1 unless wave 3 itself was shorter than wave 1, in which case wave 5 had to be shorter than wave 3.
If wave B reached or exceeded wave 5, the checklist classified the following C wave as a failure. A failed-c-wave is a C-wave treated as truncated when wave B has already reached or exceeded the prior fifth-wave high. That is why the monthly S&P 500 count, with wave B labeled as high as or higher than wave 5, allowed wave C to finish at any of three Fibonacci ratio levels rather than at one price.
All readings on this track · 18 readings
- 1986Copper wave degree and channel objectives
- 1987Constructing a price-time Fibonacci window for the ABC correction
- 1989Building entry and exit rules from pivots, channels, and abc-corrections
- 1989Constructing ABC Fibonacci expansion objectives
- 1990Calendar windows for three-wave pullbacks
- 1990Labeling wave 1, B, or X after a five-wave C
- 1991Constructing an Elliott zigzag with ABC Fibonacci checkpoints
- 2002Constructing Elliott wave ABC and triangle pattern counts
- 2003A bear-market bounce as a second wave, an RSI nonconfirmation, and an ABC relabel
- 2004A pretrade risk lockbox at Elliott ABC ends
- 2005Three-check identification of an ABC pause in an uptrend
- 2005The 61.8 percent Fibonacci line as a zigzag kill-switch
- 2005Constructing volume-float channels for ABC corrections
- 2008When monthly wave counts split, freeze the ABC and Fibonacci brackets
- 2012Fiery bull construction from sector thrust to wave count
- 2013Critiquing rigid Elliott wave ratios after computerized trading
- 2018V-wave count construction from impulse and ABC corrections
- 2018Constructing short hypotheses from completed ABC corrections