2005issue C041-4
The 61.8 percent Fibonacci line as a zigzag kill-switch
Lock an ABC correction at cycle degree first, then treat a B-wave print through 61.8 percent of A as a falsification of the simple-zigzag hypothesis. Editorial interpretation: TradersWeek reads that Fibonacci line as a ceiling, not a magnet.
- An Elliott-wave reading is incomplete until it names wave degree and places the local swing inside a larger count.
- On the revised count, March 2000 to October 2002 is Cycle A and the 2002-05 advance is Cycle B.
- A zigzag B-wave was specified as retracing no more than 61.8 percent of A, with that line placed near 1260 on the S&P 500.
- A move through that 61.8 percent ceiling would undermine the simple-zigzag label. Editorial interpretation: treat the line as a kill-switch, not a missed target.
Name the degree before measuring
An Elliott-wave reading that marks a five-wave or three-wave swing without naming the degree of those waves and placing them inside a larger count is treated as incomplete. Wave-degree is the scale label that states which swings belong together and which are only internal subdivisions of a larger pattern.
Elliott-wave work here is a nested labeling of five-wave advances and three-wave corrections. The local ABC has to sit inside that larger count before any Fibonacci retracement is asked to do work. Editorial interpretation: TradersWeek treats the degree lock as the first step, not a later footnote. Until Cycle A is named, 61.8 percent of A has no zigzag hypothesis to test.
The cycle-degree parent count
The 1974-2000 advance was labeled a cycle-degree fifth wave and was described as five primary waves: three rising legs (1974-77, 1980-87, 1987-2000) and two falling legs (1977-80 and 1987). That fifth wave is the parent count for the post-2000 work.
The opening down-leg of the larger post-2000 correction was modeled as a zigzag: five-wave A, three-wave B, five-wave C. An abc-correction in zigzag form subdivides 5-3-5 and is complete only when C moves beyond the end of A. A zigzag is the sharp ABC variety whose B-wave is corrective.
Revising Cycle A and mapping Cycle B
The autumn 2001 low was discarded as the Cycle A trough because the 2002-early-2005 advance ran too long and too far, including through the spring 2002 highs. The October 2002 low was used instead. Weekly lows in August 2002, October 2002, and March 2003 formed a head-and-shoulders or triple-bottom cluster with long lower shadows, cited as structure that a major low had formed.
On the revised count, March 2000 to October 2002 is Cycle A, and the 2002-05 advance is Cycle B. Cycle B itself split into an October 2002-January 2004 rise, a January 2004-August 2004 decline, and a new advance from August 2004.
61.8 percent of A is a ceiling
A zigzag B-wave was specified as retracing no more than 61.8 percent of A. Fibonacci-retracement here is a ratio measured on the same price swing used for the wave count: 61.8 percent of wave A is the published ceiling for a simple zigzag B-wave. That Fibonacci line was placed near 1260 on the S&P 500, about 5 percent above the then-current area near 1200.
Editorial interpretation: TradersWeek does not read 1260 as a destination. It reads the line as the last print still allowed if Cycle B is still a simple zigzag. A B-wave that stays under the ceiling keeps the 5-3-5 zigzag hypothesis alive. A B-wave that prints through it does not.
What a break of the ceiling implied
A move through that 61.8 percent ceiling would undermine the simple-zigzag label. One alternative size projection treated a 2004-low rally equal to the 2002-low rally as roughly 350 points, near 1400.
Editorial interpretation: that alternative is a different size hypothesis after the zigzag has failed the 61.8 percent test. It is not a second target to keep while the simple-zigzag label is still being defended. The working order is fixed: name the cycle-degree ABC, measure 61.8 percent of A, and drop the zigzag if B prints through the line.
S&P 500 versus the 61.8 percent Cycle A ceiling
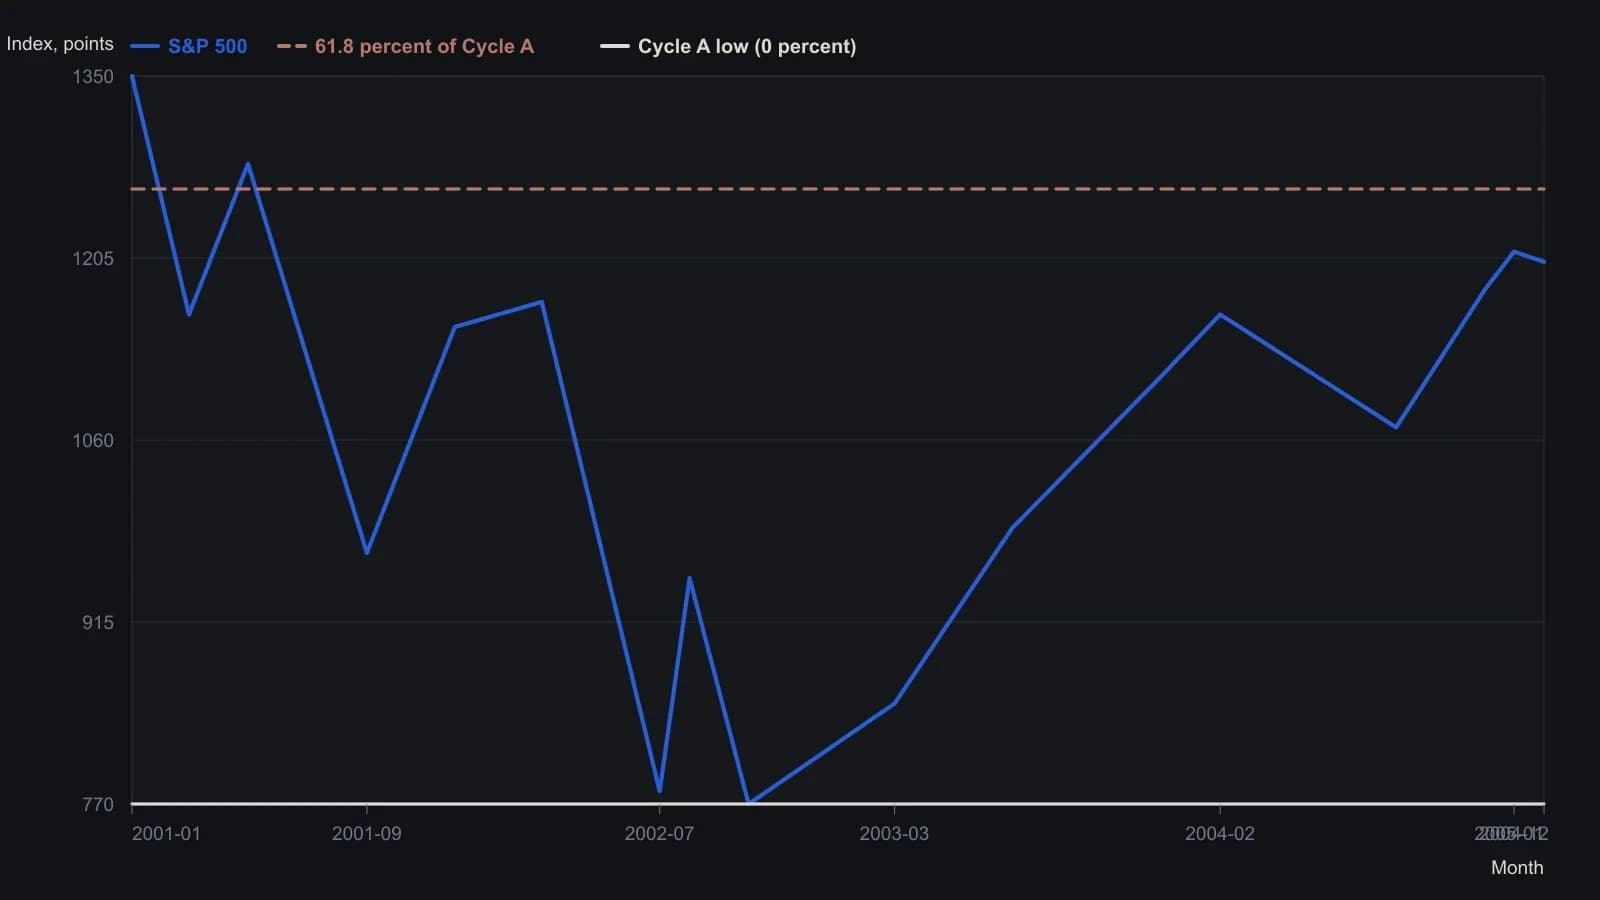
Source bars are daily or weekly; turning points were sampled and rounded to the nearest 10 index points because the raster cannot support tick-level precision. The quote header prints 1,202.02. The article also names 1,400 as a follow-on zone if 1,260 is taken out; that zone is not drawn here.
All readings on this track · 18 readings
- 1986Copper wave degree and channel objectives
- 1987Constructing a price-time Fibonacci window for the ABC correction
- 1989Building entry and exit rules from pivots, channels, and abc-corrections
- 1989Constructing ABC Fibonacci expansion objectives
- 1990Calendar windows for three-wave pullbacks
- 1990Labeling wave 1, B, or X after a five-wave C
- 1991Constructing an Elliott zigzag with ABC Fibonacci checkpoints
- 2002Constructing Elliott wave ABC and triangle pattern counts
- 2003A bear-market bounce as a second wave, an RSI nonconfirmation, and an ABC relabel
- 2004A pretrade risk lockbox at Elliott ABC ends
- 2005Three-check identification of an ABC pause in an uptrend
- 2005The 61.8 percent Fibonacci line as a zigzag kill-switch
- 2005Constructing volume-float channels for ABC corrections
- 2008When monthly wave counts split, freeze the ABC and Fibonacci brackets
- 2012Fiery bull construction from sector thrust to wave count
- 2013Critiquing rigid Elliott wave ratios after computerized trading
- 2018V-wave count construction from impulse and ABC corrections
- 2018Constructing short hypotheses from completed ABC corrections