2005issue C011-4
Three-check identification of an ABC pause in an uptrend
This archive case study defines a mid-uptrend ABC pause as a three-swing nest that stays above the trend-start and below the impulse peak. Editorial reading groups the workflow into three checks: confirm that geometry, compare the C depth with a Fibonacci-scale retracement of the prior advance, and treat a published trendline close as a resume event that fails on an old-high-stall or a slide under C.
- An ABC pause is accepted only when A, B, and C sit above the trend-start and below the impulse peak, with B above A, C below A, and no significant turn between the impulse peak and A.
- The most common depth of C relative to the prior advance falls between 65 percent and 70 percent, the median depth is 64 percent, and that cluster sits near the 61.8 percent Fibonacci retracement.
- A close through a declining B-to-C line or a line from the impulse peak through B, or a close above B or the intraday high at A, is treated as a testable resume event.
- Illustrated failures include a geometrically valid pause that slides another 7 percent through a stop just under C, and a valid ABC that stalls at the prior impulse high instead of extending through it.
What the archive treats as an ABC pause
The archive defines an ABC correction as a three-swing pause labeled A-B-C inside a prior advance, with B above A and C below A, and with the whole swing nest sitting above the trend-start and below the impulse peak.
The trend-start is the major turn from down or sideways into the advance that precedes the pause. The correction low is required to remain above this origin.
Chiron daily prices through the 1999 ABC pause
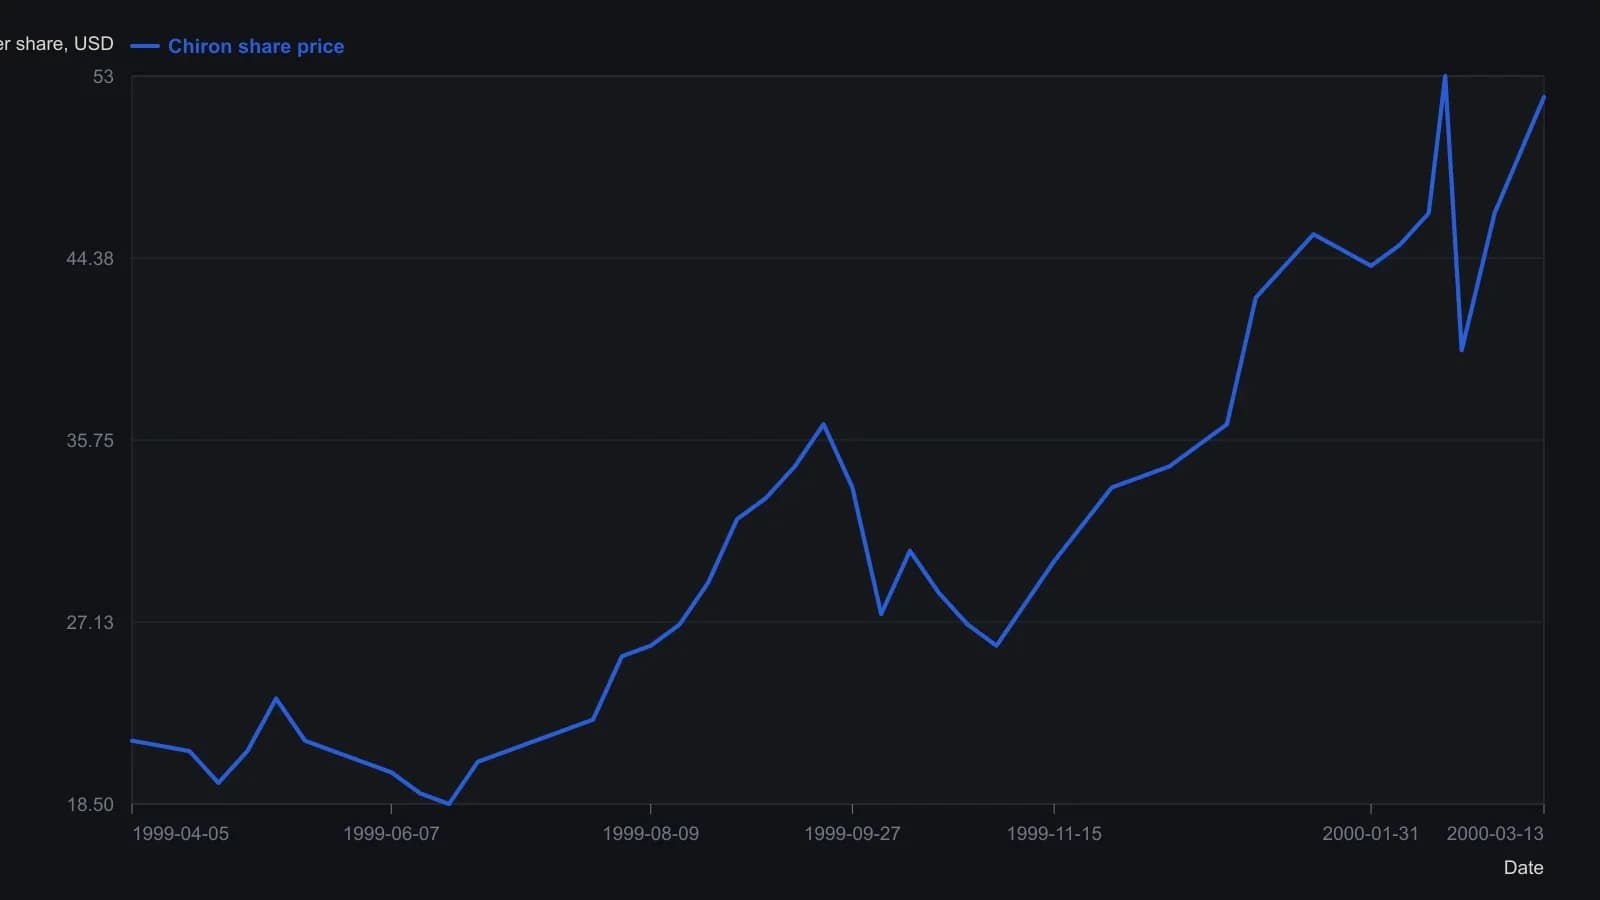
Weekly-to-fortnightly readings from the magazine candlestick pane. The raster supports about half-dollar precision, not official prints.
Check one: nest geometry
A, B, and C all sit above the uptrend origin and below the prior impulse peak. The origin itself sits below C, B sits above A, and C sits below A. No significant turn is allowed between the impulse peak and A.
A neighboring three-swing sequence is rejected as an ABC when its middle high stands above its first high.
Check two: Fibonacci depth of C
Fibonacci retracement is used as a depth scale that compares the peak-to-C pullback with the full trend-start-to-peak advance. The most common depth of C relative to the prior advance falls between 65 percent and 70 percent, the median depth is 64 percent, and that cluster sits near the 61.8 percent reference.
Check three: a published resume event
A trendline is drawn either along the B-to-C decline or from the impulse peak through B. A close through that line is treated as a testable resume event. When B is not the relevant join, the line uses a later nearby peak.
The specified tests are a close through a declining line along B to C, or a close through a line from the impulse peak through B. Alternative confirmation events are a close above B or a close above the intraday high at A.
When a valid ABC still fails
One illustrated failure stays geometrically valid, then moves sideways after C and falls another 7 percent before recovering, so a stop placed just under C is reached.
Another illustrated case completes a valid ABC but stalls at the prior impulse high instead of extending through it. That old-high-stall is a return to the impulse peak after C that fails to extend through it, used here as a clear falsification of the extended-advance hypothesis. A slightly lower nearby peak after that high is not treated as a disqualifying turn.
Volume during the pause
Volume during the pause is most often described as dome-shaped. U-shaped volume also appears in illustrated examples.
All readings on this track · 18 readings
- 1986Copper wave degree and channel objectives
- 1987Constructing a price-time Fibonacci window for the ABC correction
- 1989Building entry and exit rules from pivots, channels, and abc-corrections
- 1989Constructing ABC Fibonacci expansion objectives
- 1990Calendar windows for three-wave pullbacks
- 1990Labeling wave 1, B, or X after a five-wave C
- 1991Constructing an Elliott zigzag with ABC Fibonacci checkpoints
- 2002Constructing Elliott wave ABC and triangle pattern counts
- 2003A bear-market bounce as a second wave, an RSI nonconfirmation, and an ABC relabel
- 2004A pretrade risk lockbox at Elliott ABC ends
- 2005Three-check identification of an ABC pause in an uptrend
- 2005The 61.8 percent Fibonacci line as a zigzag kill-switch
- 2005Constructing volume-float channels for ABC corrections
- 2008When monthly wave counts split, freeze the ABC and Fibonacci brackets
- 2012Fiery bull construction from sector thrust to wave count
- 2013Critiquing rigid Elliott wave ratios after computerized trading
- 2018V-wave count construction from impulse and ABC corrections
- 2018Constructing short hypotheses from completed ABC corrections