1986issue C061-4
Copper wave degree and channel objectives
A historical copper labeling nested an up cycle after a completed abc-correction and used a price-channel, not a two-point trendline, for the next piece. This editorial reading treats that live count as a sequence check: after waves one and three of a degree, only a correction is allowable.
- After a first or third wave of any size, the next expected structure is only a correction, which becomes wave two or four.
- Five waves of one wave-degree complete a single wave of the next larger degree, nesting from minor through intermediate, major, and cycle scales.
- Objective lines were drawn as a price-channel rather than a two-point trendline, because a two-point line mixes direction with the rate of movement.
- Locating the wave in which a market is currently trading is used to estimate the size and direction of the next known wave.
A nested sequence check
This editorial reading treats a live Elliott wave count as a nested sequence check. Once waves one and three of a given wave-degree are in, the only allowable next piece is a correction, which becomes wave two or four.
Elliott wave analysis is a nested five-wave impulse and three-wave correction framework used to locate the current wave so the next degree-consistent move can be hypothesized. Locating the wave in which a market is currently trading is used to estimate the size and direction of that next known wave.
Wave degree and the impulse sequence
A five-wave sequence advances in steps: three waves in the trend direction separated by two opposite-direction corrections. That impulse-sequence is the five-wave building block of a larger advance or decline.
Five waves of one wave-degree complete a single wave of the next larger degree, nesting from minor through intermediate, major, and cycle scales. A second or fourth wave of a larger degree is generally larger than any of the five preceding smaller-degree waves, regardless of correction shape.
Copper after a completed cycle correction
In the historical workflow, copper's 1980 peak near 1.45 was labeled as the end of an up cycle. A completed abc-correction then ran as a three-leg zigzag roughly 1.45 to 0.85, 0.85 to 1.12, and 1.12 to 0.53. An abc-correction can finish a corrective cycle of a given degree before the next larger impulse is expected.
With that cycle-degree abc-correction labeled complete, the next larger structure was reasoned to be an up cycle built from five major waves, each subdividing into five intermediate, five minor, and five minute waves.
Weekly labels and channel objectives
On the weekly labeling, the first intermediate advance of major wave 1 ended near 0.80 and the following intermediate correction ended near 0.55, after which price was counted as intermediate wave 3.
Objective lines were drawn as a price-channel rather than trendlines, because a two-point trendline mixes direction with the rate of movement and can fail when prices move sideways while direction remains intact. Parallel objective lines estimate where the present wave should complete and keep directional bias separate from the rate at which price travels.
After a third minute wave tagged the upper channel, the next expected piece was a minute-wave-4 pullback or sideways move toward the lower channel near 65.00 to 66.00. This editorial reading treats that channel-objective as the zone that would keep the required correction honest.
Copper nearest-futures weekly range, 1982–1985
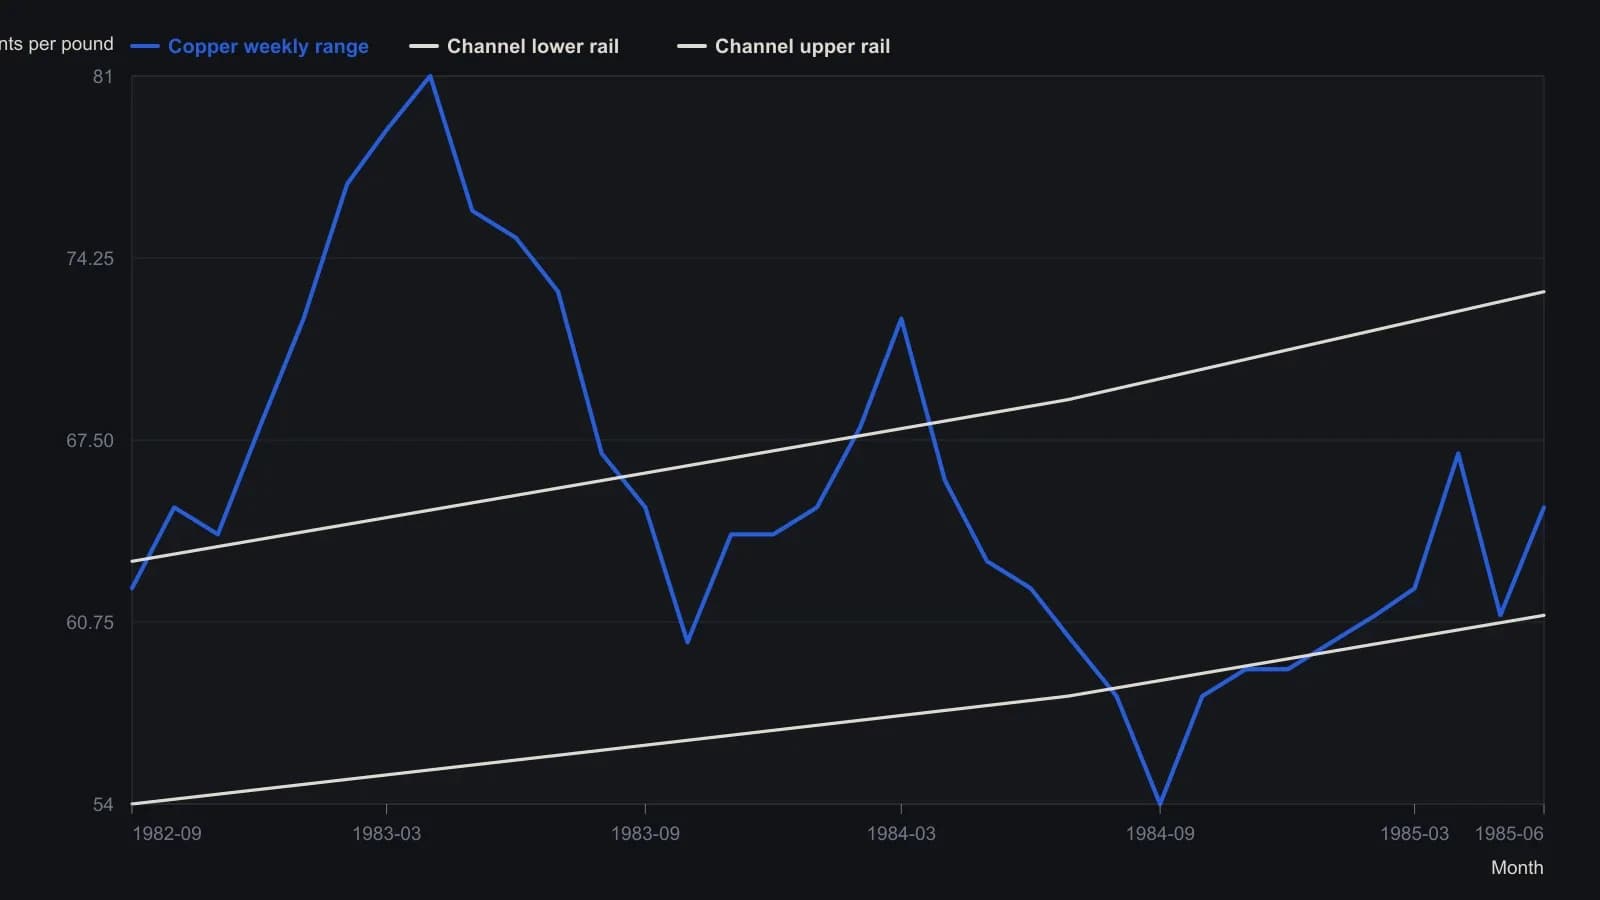
Y-values are approximate to the nearest cent: weekly-range midpoints and labeled swing extremes digitized from the high-low bars. The source prints no numeric table. Channel rails follow the parallel lines drawn after the B low.
All readings on this track · 18 readings
- 1986Copper wave degree and channel objectives
- 1987Constructing a price-time Fibonacci window for the ABC correction
- 1989Building entry and exit rules from pivots, channels, and abc-corrections
- 1989Constructing ABC Fibonacci expansion objectives
- 1990Calendar windows for three-wave pullbacks
- 1990Labeling wave 1, B, or X after a five-wave C
- 1991Constructing an Elliott zigzag with ABC Fibonacci checkpoints
- 2002Constructing Elliott wave ABC and triangle pattern counts
- 2003A bear-market bounce as a second wave, an RSI nonconfirmation, and an ABC relabel
- 2004A pretrade risk lockbox at Elliott ABC ends
- 2005Three-check identification of an ABC pause in an uptrend
- 2005The 61.8 percent Fibonacci line as a zigzag kill-switch
- 2005Constructing volume-float channels for ABC corrections
- 2008When monthly wave counts split, freeze the ABC and Fibonacci brackets
- 2012Fiery bull construction from sector thrust to wave count
- 2013Critiquing rigid Elliott wave ratios after computerized trading
- 2018V-wave count construction from impulse and ABC corrections
- 2018Constructing short hypotheses from completed ABC corrections