2003issue C081-4
A bear-market bounce as a second wave, an RSI nonconfirmation, and an ABC relabel
This editorial classroom maps the March-April 2003 S&P 500 bounce in two steps. First lock a second-wave ceiling to a prior same-degree peak and wait for an RSI upside nonconfirmation. Promote the rally to a same-degree ABC only if its size forces a degree-relabel.
- Lock a bear-market second-wave ceiling to a prior same-degree peak before treating the bounce as complete.
- Invert bull-market second-wave language: an upward correction can recover most of the first-wave decline, attract buyers who wanted one more dip, and still print upside nonconfirmations.
- Require an RSI upside nonconfirmation before calling the advance spent, and treat a failure swing as added confirmation only after the oscillator breaks its latest trough.
- Promote the bounce to a same-degree ABC only when amplitude forces a degree-relabel and the next larger ceiling still holds.
A two-map classroom
Elliott-wave is a structured reading of impulse and corrective swings on OHLC charts, used here to bound a countertrend second-wave rally against a prior same-degree peak. In the March-April 2003 S&P 500 advance, that mapping treated the bounce as a second-wave: the first full countertrend retracement after wave one. Inside a bear market the second-wave is an upward recovery that can erase most of the opening decline.
The archive later offered a second reading. Editorial framing keeps those readings as two maps, not one blended count: stay with the second-wave ceiling until the bounce is large enough to force a degree-relabel into an abc-correction.
Lock the second-wave ceiling
The 2003 second-wave map allowed the bounce to reach the prior higher-degree wave-4 peak near 954, printed on December 2 at the end of the October 2002 rally. A nearer resistance for that same bounce was the January 13 peak at 935, also identified as the right shoulder of the head-and-shoulders top that preceded the late-January through mid-March decline.
Invert the bull-market script
Second-wave language written for downward corrections in bull markets was inverted for upward corrections in a bear market. The bounce can recover most of the first-wave decline, attract buyers who wanted one more dip, and print upside nonconfirmations.
After the March 24, 2000 S&P 500 high of 1552.87, wave one ended April 14 at 1339.40, a 13.7 percent decline. The later second-wave high of 1530.09 on September 1 stood less than 23 points from that prior extreme.
Two historical downward second waves, the Dow primary second from 1976 to March 1980 and cycle II from March 1937 to April 1942, ended with sentiment as poor or poorer than at the start of the preceding first waves, even when the wave-two low was higher than the wave-one low.
Require an RSI nonconfirmation
The relative-strength-index is a bounded oscillator of sequential price observations used to test whether a new high is confirmed or prints an upside nonconfirmation. An upside-nonconfirmation is a new price high that a confirming tool such as the relative strength index fails to match.
From late March to early May 2003, S&P 500 price made a higher April high while the relative strength index failed to exceed its late-March high, so the oscillator trended down as the index trended up.
A failure-swing is an oscillator turn that breaks back through its most recent trough, treated as added confirmation that a price reversal may be underway. At publication the S&P 500 RSI had not yet broken its recent trough near 45.34. Editorial reading: the upside nonconfirmation was in place, but the failure-swing confirmation was not.
Promote to ABC only after a degree-relabel
An abc-correction is a three-swing corrective advance used when a bounce is large enough to share degree with the prior decline rather than remain a smaller second wave. Degree-relabel means revising which wave size a rally belongs to when its amplitude exceeds the original second-wave map.
A later count recast the mid-March 2003 advance as a same-degree C-wave after an October-December 2002 A-wave rise and a December 2002-March 2003 B-wave decline, provided the rally stayed below the spring 2002 highs near 1180.
Editorial reading: the ABC map replaces the second-wave map only when size forces the change and that next larger ceiling still holds. It is not a second label applied at the same time.
S&P 500 daily path of the spring 2003 bounce
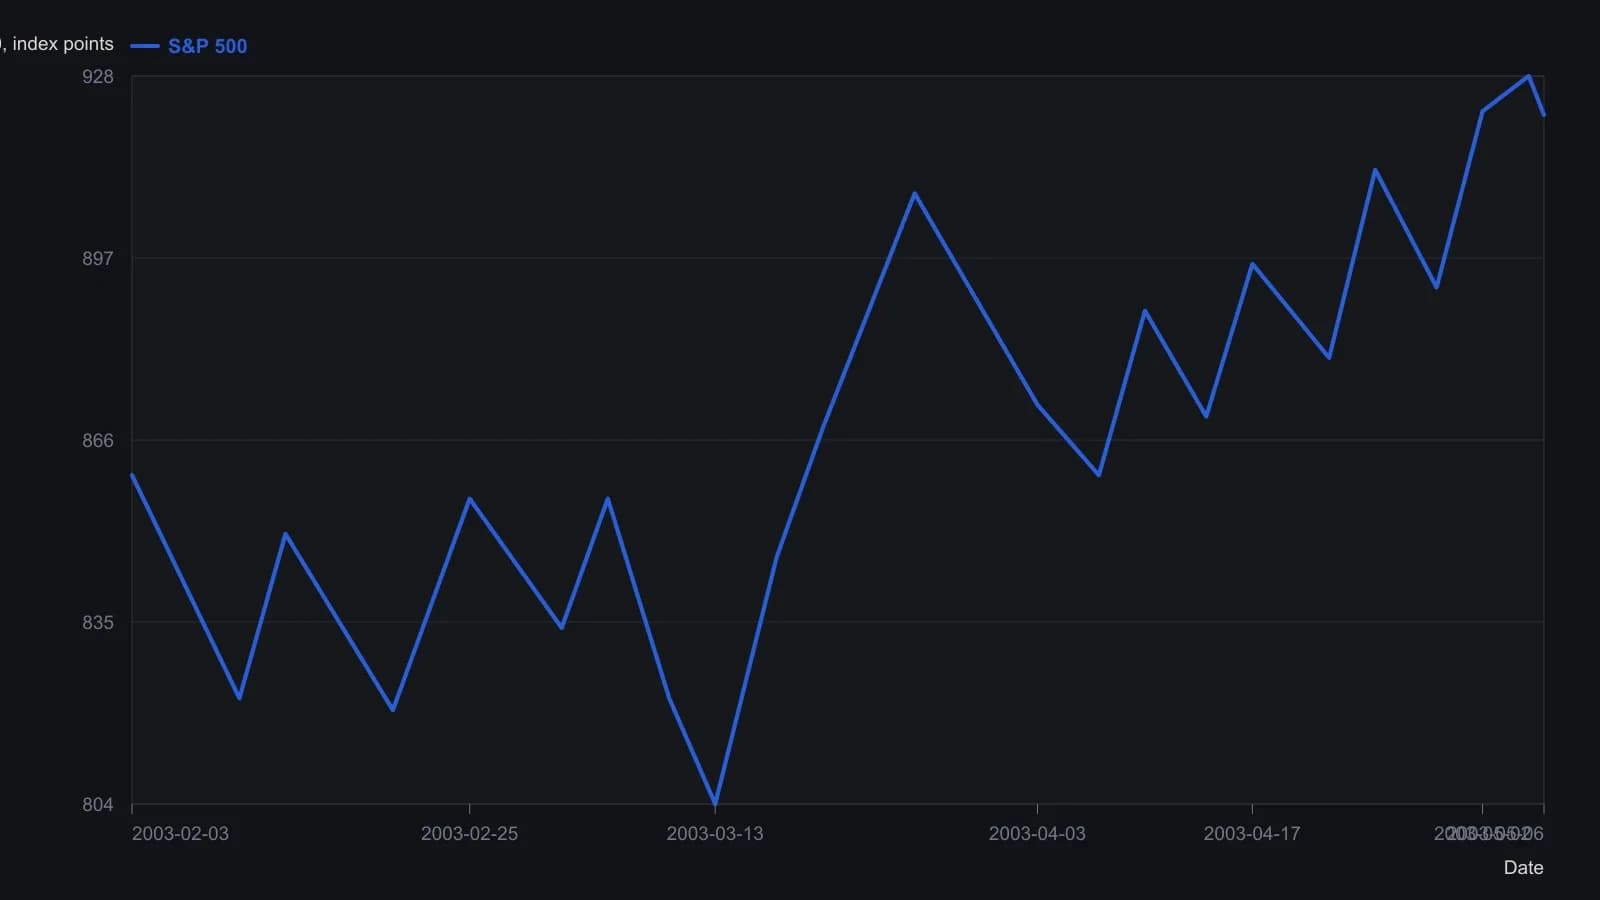
Digitized from the daily candlestick raster; readings are approximate to a few index points. The 921.35 close is the printed chart header. RSI is discussed in the source (late-March high not exceeded; trough near 45.34) but is omitted here because it does not share the price scale.
All readings on this track · 18 readings
- 1986Copper wave degree and channel objectives
- 1987Constructing a price-time Fibonacci window for the ABC correction
- 1989Building entry and exit rules from pivots, channels, and abc-corrections
- 1989Constructing ABC Fibonacci expansion objectives
- 1990Calendar windows for three-wave pullbacks
- 1990Labeling wave 1, B, or X after a five-wave C
- 1991Constructing an Elliott zigzag with ABC Fibonacci checkpoints
- 2002Constructing Elliott wave ABC and triangle pattern counts
- 2003A bear-market bounce as a second wave, an RSI nonconfirmation, and an ABC relabel
- 2004A pretrade risk lockbox at Elliott ABC ends
- 2005Three-check identification of an ABC pause in an uptrend
- 2005The 61.8 percent Fibonacci line as a zigzag kill-switch
- 2005Constructing volume-float channels for ABC corrections
- 2008When monthly wave counts split, freeze the ABC and Fibonacci brackets
- 2012Fiery bull construction from sector thrust to wave count
- 2013Critiquing rigid Elliott wave ratios after computerized trading
- 2018V-wave count construction from impulse and ABC corrections
- 2018Constructing short hypotheses from completed ABC corrections