2013issue C0210-13
GARCH and a volatility rank as market-regime classifiers
A market can leave a short-horizon reversal pattern and enter a prolonged directional run without a gradual warning. This article teaches a zero-to-one historical-volatility rank that crosses 0.5 to pair reversal tools or trend tools, then sets that starter classifier beside a GARCH volatility forecast.
- A market can leave a short-horizon reversal pattern and enter a prolonged directional run without a gradual warning, so a strategy that stays in the old mode can absorb a sizable drawdown before it is adjusted.
- Both the level of volatility and whether that volatility is rising or falling are used as a first indication of whether the market looks directional or mean-reverting.
- A volatility-switch-indicator that rises through 0.5 is treated as increasing volatility and mean-reversion-mode; a value that declines through 0.5 is treated as falling volatility and the start of trending-mode.
- A simple historical-volatility rank is presented as a starter regime classifier that can sit beside more formal volatility-forecast constructions, including a GARCH model used to switch a trading system.
When the tape changes without warning
A market can leave a short-horizon reversal pattern and enter a prolonged directional run without a gradual warning. A strategy that stays in the old mode can absorb a sizable drawdown before it is adjusted.
Regime switching is presented as a way to retune a strategy when conditions move from a directional mode to a mean-reverting mode. A volatility measure sits at the center of most such algorithms.
Both the level of volatility and whether that volatility is rising or falling are used as a first indication of whether the market looks directional or mean-reverting.
Building the volatility-switch-indicator
The construction is described as needing at least one year of observations. Three to five years or more are said to give a more reliable view of how a security responds when volatility changes.
A 21-session historical-volatility series is built from successive mid-price percentage changes. Historical-volatility here is the standard deviation of those changes over that fixed window. The series is then converted to a zero-to-one rank by counting how many of the recent volatility readings are less than or equal to the latest reading. That rank is the volatility-switch-indicator: a score that crosses 0.5 to flag a change in market personality.
A switch value that rises through 0.5 is treated as increasing volatility and a choppy, mean-reverting setting. A value that declines through 0.5, especially from a recent reading near 1, is treated as falling volatility and the start of a directional episode.
Rising volatility is framed as higher uncertainty and a choppy tape. Falling volatility is framed as greater directional certainty. The 21-session window is an unoptimized starting point rather than a fitted lookback.
Which tools sit with each side of 0.5
Market-regime-classification in this workflow is the rule that labels the tape as trending or mean-reverting so a different indicator family can be applied.
Above the 0.5 threshold the setting is mean-reversion-mode: a choppy, higher-uncertainty state. Short-horizon reversal tools such as a stochastic oscillator or a relative-strength index are paired with the switch.
Below 0.5 the setting is trending-mode: a lower-volatility, higher-certainty state. Trend tools such as MACD or a moving-average crossover are paired instead.
S&P 500 21-day volatility-switch rank
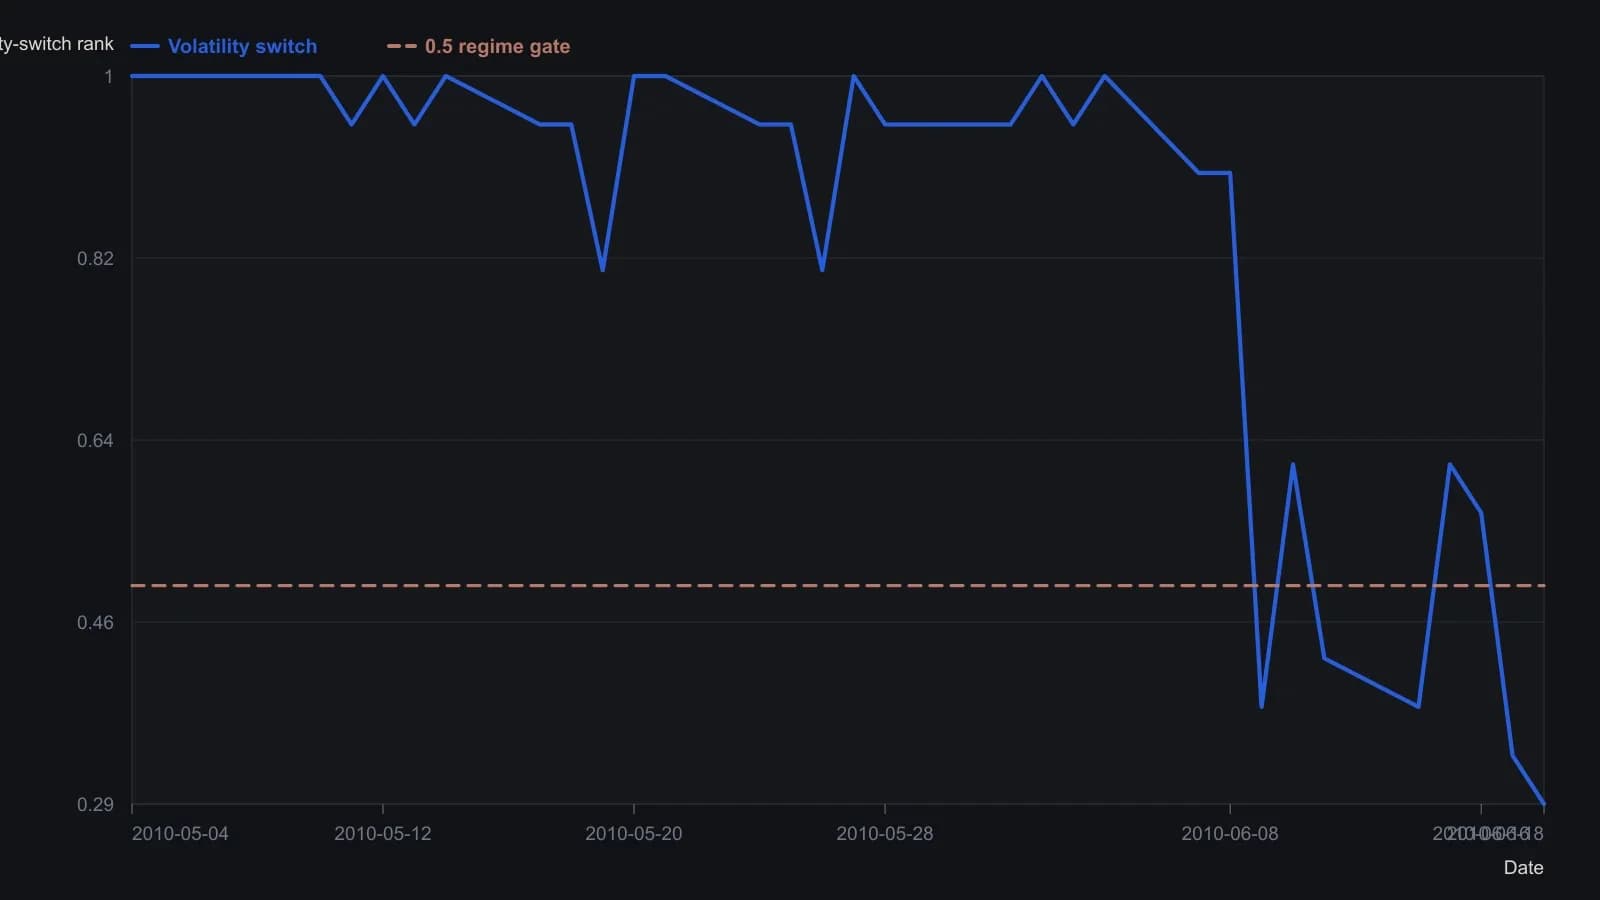
Lookback is fixed at 21 sessions; the author states that window was not optimized.
The same decision beside a GARCH forecast
A simple historical-volatility rank is presented as a starter regime classifier that can sit beside more formal volatility-forecast constructions, including GARCH-based forecasts used to switch a trading system.
A GARCH model is the formal counterpart to that rank: a quantitative volatility model that turns ordered price observations and a defined lookback into an explicit forecast. The volatility forecast is a projected path used to anticipate whether conditions are likely to stay choppy or become more directional.
All readings on this track · 6 readings
- 1994Constructing hourly index futures lattices from live volatility
- 1995A short-to-long historical-volatility ratio as a regime-gate
- 2001Constructing a variable-interval average from a difference-oscillator or volatility forecast
- 2006Percent-scale average true range for comparable range
- 2007Historical compression and implied slope as a futures regime map
- 2013GARCH and a volatility rank as market-regime classifiers