1995issue C111-5
A short-to-long historical-volatility ratio as a regime-gate
Build historical volatility twice with one locked annualization-day-count: a 10-observation short-window and a 100-observation long-window. Their volatility-ratio is a regime-gate at the 0.5 compression-threshold. Editorial: that label is a place a later expansion forecast can occupy.
- A 10-observation short-window and a 100-observation long-window use the same log-return standard-deviation recipe and share one annualized percent scale.
- The volatility-ratio is the short-window series divided by the long-window series. A reading at or below 0.5 is the compression-threshold.
- An example regime-gate allows a close-versus-20-session exponential-average entry only if that ratio was at or below 0.5 within the prior 10 sessions.
- If the long-window is treated as roughly stable, a short-window well below that baseline is presented as a cue to anticipate higher subsequent volatility.
Two windows on one percent scale
A 10-observation historical-volatility reading is formed from the standard deviation of log close-to-close ratios, then scaled by the square root of 365 and by 100. Each log-return is the natural logarithm of the current close divided by the prior close.
The same log-return standard-deviation construction with a 100-observation lookback produces a slower historical-volatility series on the same annualized percent scale. The illustrated short-window and long-window lookbacks are 10 and 100 sessions.
The volatility-ratio and the compression-threshold
Dividing the 10-observation series by the 100-observation series yields a unitless volatility-ratio. A value below 0.5 means the short-window is less than half the long-window.
That 0.5 level is the compression-threshold. A short-window reading below 50 percent of the long-window reading is the stated cue to anticipate unusually high subsequent volatility.
Yen 10-day/100-day historical-volatility ratio
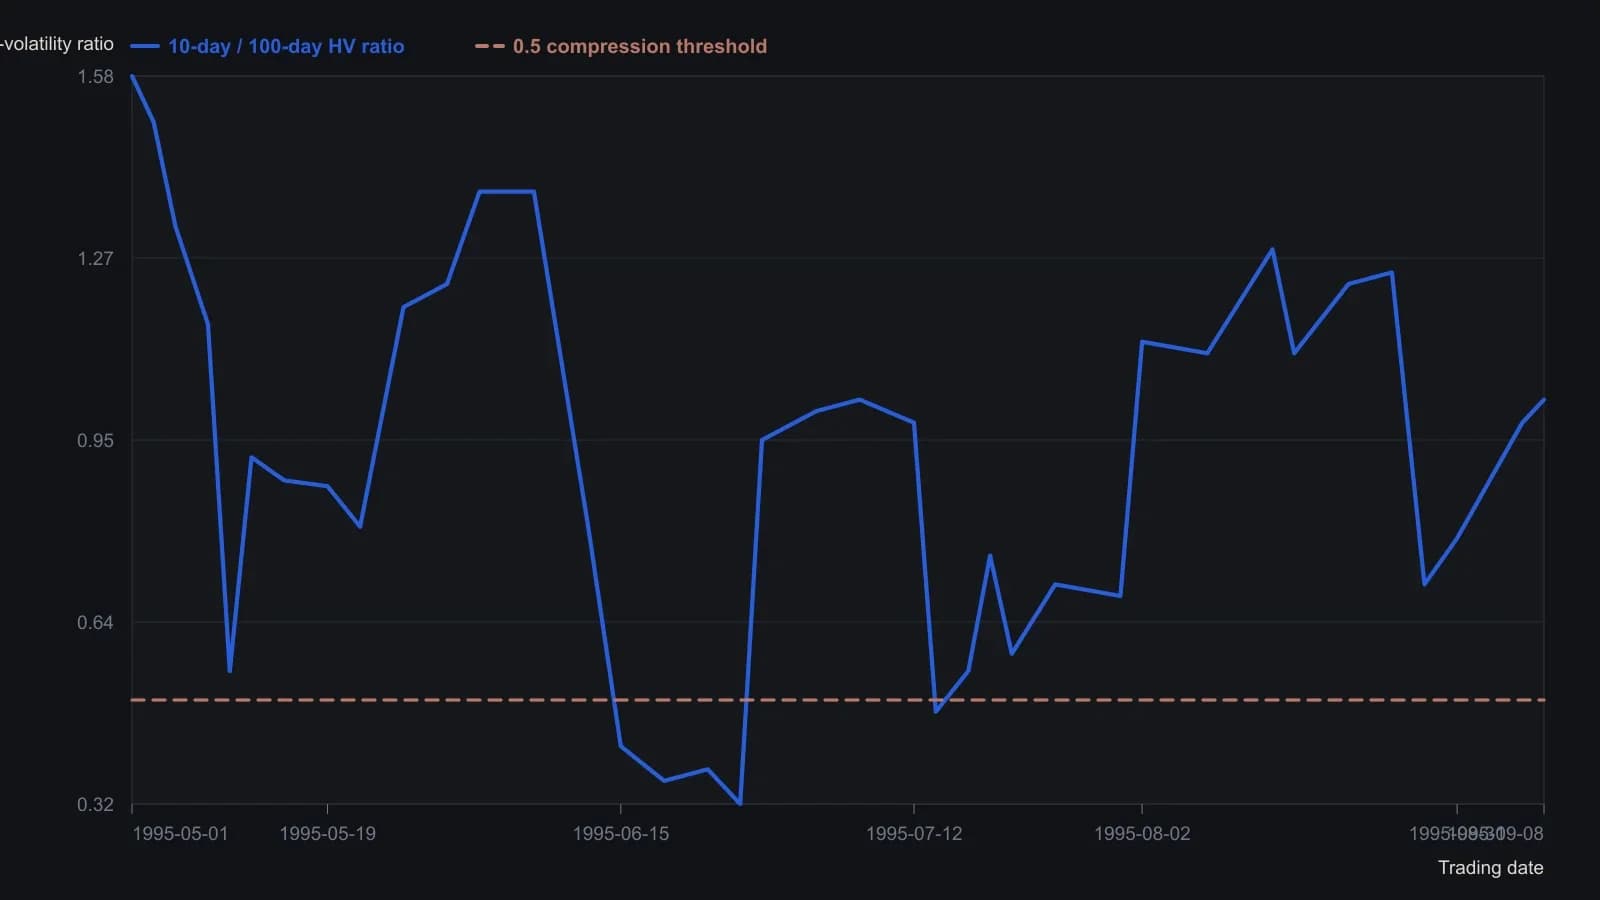
Both windows use Std(log close-to-close)×√365×100, so those factors cancel in the plotted ratio. The 0.5 line is the gate stated in the tip, not a fitted level. Screenshot readings are only good to about 0.05.
One annualization-day-count for both windows
The same construction is shown with two annualization-day-count conventions: a 365-day calendar count and a 260-day trading-day count. Editorial: lock one convention so the short-window and the long-window stay on one scale before the ratio is formed.
One worksheet form of the same two-window construction multiplies each window's root-mean-square log move by the constant 7.22 instead of computing the square root of 365 divided by 7.
A parameterized function can take lookback length and annualization-day-count as inputs, scale log-return standard deviation by the square root of that day-count divided by 1 on daily bars or 7 on weekly bars, and express the result in percent.
A regime-gate for a separate trend rule
An example entry rule requires a close crossing a 20-session exponential average and, within the prior 10 sessions, a volatility-ratio at or below 0.5.
Editorial: that volatility-ratio condition is a regime-gate. A separate trend rule consults it before an entry is allowed. The ratio labels a regime. It does not replace the trend rule.
The stated follow-on for a compressed short-window
If long-window volatility is treated as roughly stable, a short-window falling well below that baseline is presented as a condition that should be followed by higher volatility. Otherwise the long-window itself would fall.
Editorial: treat a volatility-ratio below the compression-threshold as a regime label that a later expansion forecast can occupy.
All readings on this track · 6 readings
- 1994Constructing hourly index futures lattices from live volatility
- 1995A short-to-long historical-volatility ratio as a regime-gate
- 2001Constructing a variable-interval average from a difference-oscillator or volatility forecast
- 2006Percent-scale average true range for comparable range
- 2007Historical compression and implied slope as a futures regime map
- 2013GARCH and a volatility rank as market-regime classifiers