1996issue C071-9
Evaluating a daily volume-strength and new-high new-low timing procedure
Daily NYSE advance-decline volume and daily 52-week new highs and new lows can be written as one mechanical timing procedure that updates inside the week. The same fitted Vrs-NH-NL rules looked stronger in the curve-fitted section than in the earlier window, and out-of-sample drawdowns were almost twice as large.
- A weekly advance-decline and new-high/new-low market system can leave a multi-day gap between signal updates, during which adverse price movement can occur.
- Daily NYSE advance-decline volume and daily NYSE 52-week new highs and new lows can be combined into one market-timing procedure that updates inside the week.
- Volume strength (Vstr), new-high strength (NHstr), and new-low strength (NLstr) are built as separate percent-of-range readings, and the rolling 52-week new-high and new-low series should not be treated as continuous with the earlier calendar-year method.
- The same fitted Vrs-NH-NL rules produced 23 trades with 70 percent profitable in the earlier window versus 21 trades with 95 percent profitable in the curve-fitted section, while out-of-sample drawdowns were almost twice as large.
The weekly update gap
A weekly advance-decline and new-high/new-low market system can leave a multi-day gap between signal updates. Adverse price movement can occur before the next weekly calculation.
Daily NYSE advance-decline volume and daily NYSE 52-week new highs and new lows can be combined into one market-timing procedure that updates inside the week.
A break in the new-high and new-low series
From January 1978 onward, NYSE new highs and new lows are computed on a rolling 52-week basis. That construction differs from the earlier calendar-year method and should not be treated as one continuous series.
Because only the 52-week new-high and new-low series begin in 1978, system development and testing that use those series are limited to advance-decline volume from 1 January 1978 forward.
Three separate strength readings
Volume strength (Vstr) is built from the advance-decline volume ratio (Vratio): advancing volume minus declining volume, divided by their sum. Vratio is smoothed with a 10-day exponential average. Today's reading is then scaled as a percent of its lookback range into an oscillator that runs from +50 to -50.
New-high strength (NHstr) and new-low strength (NLstr) are specified independently. The two series are treated as distinct investor classes with different horizons rather than as a single combined breadth count.
The fitted Vrs-NH-NL rules and the earlier window
On daily S&P 500 data from 2 January 1987 through 29 December 1995, the fitted Vrs-NH-NL rules used Vbuy=5, Vsell=-35, Vdays=10, NLbuy=-20, NLsell=30, Ldays=40, NHbuy=-10, NHsell=20, and Hdays=10. That later sample is the curve-fitted section, the window used to choose system thresholds and lookbacks, as distinct from the earlier holdout window.
The same parameter set applied to the earlier daily S&P 500 window from 3 January 1978 through 13 March 1987 produced 23 trades with 70 percent profitable, versus 21 trades with 95 percent profitable in the later fitted window.
Daily inputs versus weekly inputs
Using daily rather than weekly inputs gave little advantage beyond the ability to act during the week. The two systems' performances were described as almost the same, with only a slight edge to the daily version.
Holdout drawdowns as the comparison
Out-of-sample drawdowns were almost twice as large as those in the curve-fitted section. The earlier window included a 23 percent drawdown from the 12 June 1981 buy during the 1981-82 decline. Future drawdowns should be expected to exceed the fitted-window figures.
Editorial (TradersWeek): judge this mechanical procedure by whether out-of-sample drawdowns stay comparable to the curve-fitted section. The higher profitable-trade share in the window used to choose the thresholds is not the standard for accepting the rules.
S&P 500 daily path, April 1980–June 1982
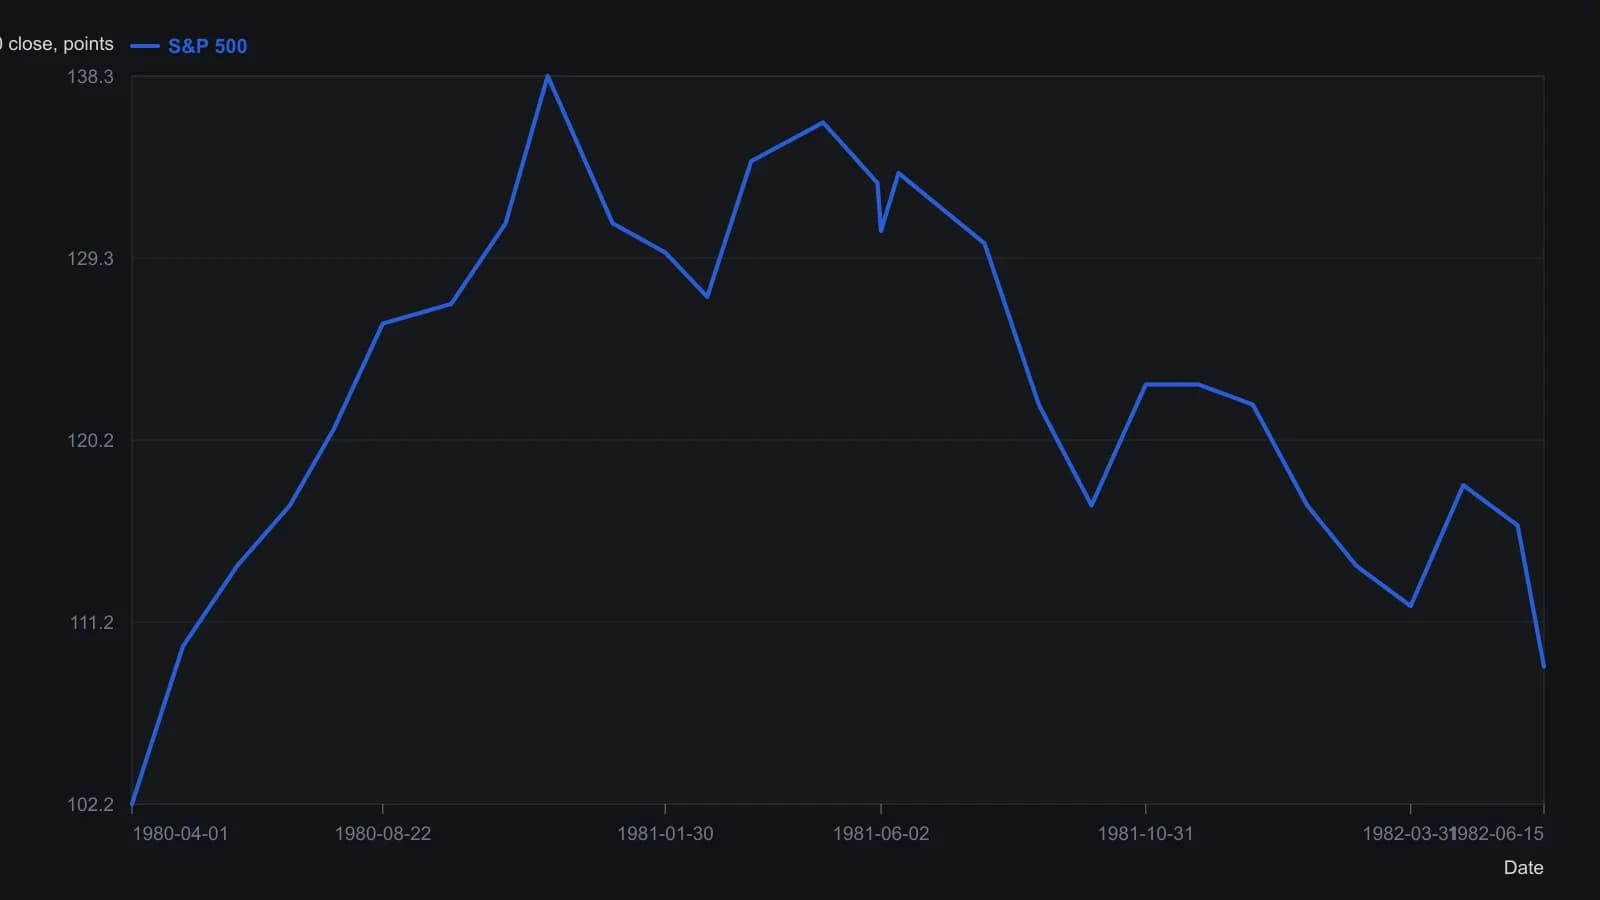
Buy and sell prints use the exact Figure 4 entry prices; other closes are read from the printed daily curve to the nearest index point. The Vrs, NLstr and NHstr panes were left unread.
All readings on this track · 23 readings
- 1984Evaluating mechanical systems beyond net profit
- 1987Mechanical systems need more than pretty charts
- 1987Evaluating silver moving averages and RSI by scoring rule
- 1988Simple systems over optimized complexity
- 1988Cycle rule inputs until the parameter search stops
- 1990Split-sample tests for stochastic parameter grids
- 1993Four-subsystem trading system construction
- 1993Randomized price paths for stock system parameters
- 1994Mechanical timing with out-of-sample and filter checks
- 1995Evaluating asymmetric percent-reversal trading rules
- 1996Evaluating a daily volume-strength and new-high new-low timing procedure
- 1997Rule-based intraday system design with genetic search
- 1997Evolving three-rule systems with genetic templates
- 1997Audit the holdout and the exposure before the fitted entries
- 2001Inner weights are part of the candlestick signal
- 2003Mechanical short-term rules for news-sensitive rallies
- 2004Band construction as a testable trading procedure
- 2006Layered day-session automation from brackets to rules
- 2006Why mechanical rules must be retuned per security
- 2006A linear-regression next-bar forecast needs a searchable cutoff
- 2015Construct if-then rules, then backtest and optimize
- 2015Mechanical system design as a critique of discretion
- 2025Joint channel design with a trend filter and stop-loss orders