2004issue C011-4
Constructing pivot commonality across timeframes
Each horizon-grid is built from the high, low, and close of a completed day, week, or month and applied only to the next period. Where those grids overlap each other or a gap, the shared area is treated as a commonality-zone that can become a support or resistance hypothesis after chart confirmation.
- The main-pivot is the mean of the just-completed bar’s high, low, and close, and it is the center of each new horizon-grid.
- First-resistance is twice that center minus the prior low, first-support is twice that center minus the prior high, second-resistance adds the prior bar’s range to the center, and second-support subtracts the distance between first-resistance and first-support from the center.
- A daily grid is taken from the previous session and drawn on a short-interval intraday chart; weekly and monthly grids are taken from the prior Monday-through-Friday range and the prior calendar month and drawn on a daily chart.
- When two or more horizons or methods occupy the same area, including gap-commonality with a monthly first-support line, the overlap is a commonality-zone; after a break, role-reversal applies, and chart confirmation is still required before a level is an entry or exit hypothesis.
A horizon-grid is a full set of pivot lines computed from one completed day, week, or calendar month and then applied only to the following day, week, or month.
Build each horizon-grid from the completed bar
The center of each new horizon-grid is the main-pivot, the mean of the just-completed bar’s high, low, and close.
First-resistance is twice that center minus the prior low. First-support is twice that center minus the prior high.
Second-resistance adds the prior bar’s range to the center. Second-support subtracts the distance between first-resistance and first-support from the center.
A daily grid is built from the previous session for the next session. A weekly grid is built from the prior Monday-through-Friday range for the coming week. A monthly grid is built from the prior calendar month for the coming month.
Place the lines on the matching chart
Daily lines are drawn on a short-interval intraday chart. Weekly and monthly lines are drawn on a daily chart.
Optional third lines and multi-bar ranges
A third support or resistance line may be added in an extreme trend. Some constructions replace the single prior bar with a two-day, three-day, or rolling five-day range.
Read overlaps as a commonality-zone
When two or more horizons or methods occupy the same area, that overlap is treated as a commonality-zone. Higher-horizon lines are allowed a noise band rather than an exact print.
A monthly first-support line can share a zone with a gap. That coincidence is gap-commonality. A probe through both that later fails to close back above the support is read as a reason to watch the next lower pivot.
Apply role-reversal after a failure
After a constructed support fails it is reread as resistance. After a constructed resistance fails it is reread as support. That convention is role-reversal.
A map of candidate turning areas
The constructed grid is a map of candidate turning areas, not a self-contained decision rule. Chart confirmation is required before treating a level as an entry or exit hypothesis.
Nested SPY weekly and monthly pivot shelves
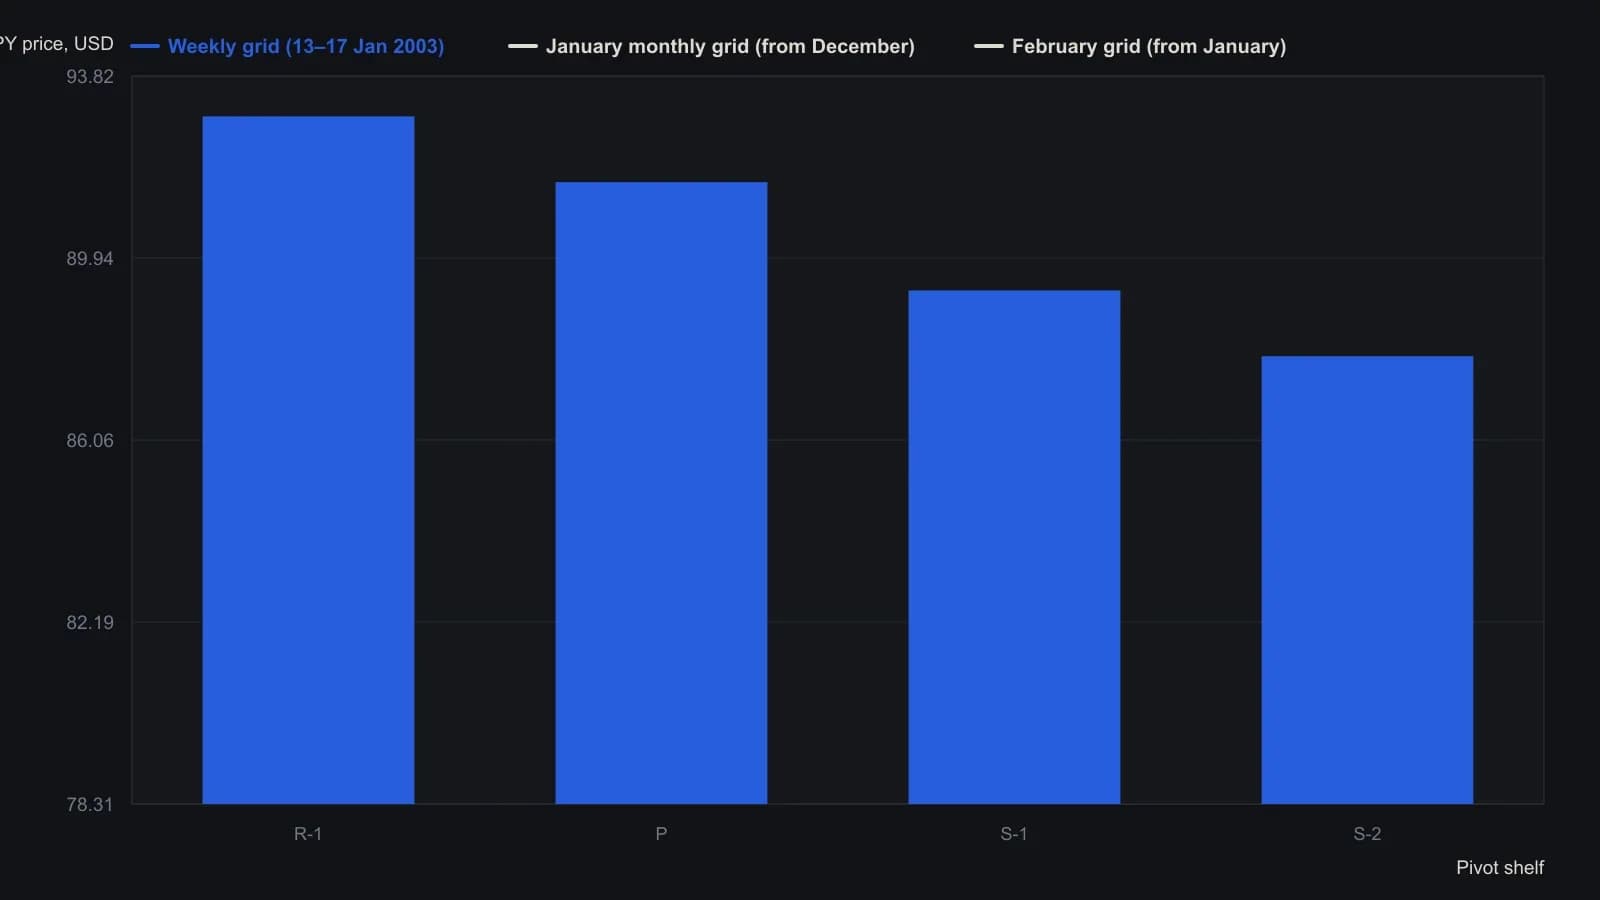
Each grid is taken from one completed day, week, or month and applied only to the next period. February R-1 is not stated in the source, so that bar is omitted. R-3 and S-3 are left off because the article uses them only in extreme trends.
All readings on this track · 11 readings
- 1987Broken bias: stops, cash flow and unfilled gaps
- 1999A surviving weekly gap still needs a confirmation-breakout
- 2000Repeatable volume-price silhouettes as falsifiable hypotheses
- 2004Constructing pivot commonality across timeframes
- 2005A finished crude-oil top as a classroom for necklines, candles, and gaps
- 2007Journal a gap breakout as three sequential gates
- 2008Same-open kicker as a two-bar reversal case
- 2010Filtered gap follow-through entry rules
- 2010Cloudbank overhead resistance and breakout recovery
- 2015Post-exit cooldown as a system rule
- 2018Classifying chart gaps before fill or follow