2003issue C091-4
Classifying breakout gaps by fill speed and throwback
A price-gap is an untraded space between sessions. Editorial reading withholds the class name until fill speed, leftover volume, and position in the swing are known. A throwback that covers a breakout-day hole is part of that test.
- A price-gap is a session whose entire range sits above the prior high or below the prior low, leaving an untraded space on the chart.
- Gap class is confirmed after later price action, using fill speed, whether a trend is already underway, and whether volume stays elevated.
- Area-gaps and exhaustion-gaps often fill within a week; breakaway-gaps usually stay open much longer.
- A throwback or pullback to the breakout zone can fill a breakout-day gap without separately naming the gap type.
Hold the class name
A price-gap is present when a session's high sits entirely below the prior low, or its low sits entirely above the prior high. The untraded space is visible on the OHLC chart at once.
Editorial reading treats gap classification as a delayed-label drill. The hole can be marked on the gap day. The class name waits until fill speed, leftover volume, and position in the swing have been observed.
Five classes
Five gap classes are distinguished: area, also called common or pattern; breakaway; continuation, also called measuring or runaway; ex-dividend; and exhaustion.
An area-gap usually leaves a sideways congestion zone. Any volume spike often fades within a day or two. The average fill time is 6 days, and 90% fill inside a week.
A breakaway-gap is a high-volume opening at the start of an extended one-direction move after a consolidation breakout. Only 1% of uptrend cases and 6% of downtrend cases filled within a week, with average fill times of 83 and 86 days.
A continuation-gap appears mid-move on high volume, typically after a breakaway-gap. One positional measure placed it 48% of the way from trend start to trend end. That reading is used as a halfway mark for projecting the rest of the swing.
An exhaustion-gap is often a large, high-volume hole at the end of an extended one-direction move. 58% of uptrend cases and 72% of downtrend cases filled within a week, and price frequently reversed afterward.
An ex-dividend-gap is uncommon and most often seen in large-dividend names. It opens downward on the distribution day and same-session trading usually covers it.
Confirm after later price action
Gap class is confirmed after later price action rather than on the gap day. The distinguishing tests are fill speed, whether a trend is already underway, and whether volume stays elevated.
Throwback as part of the test
A breakout is the session when price leaves a chart-pattern or congestion boundary. That session may or may not open with a gap.
A chart-pattern breakout can open with a gap that later fills when a throwback returns price to the breakout zone. A subsequent visit to that zone can close the hole without separately naming the gap type. A pullback is the downward counterpart of a throwback. Gap-fill is later trading that returns to the untraded space and spans it completely.
Editorial reading treats that later visit as part of the identification test rather than as a separate event. The throwback or pullback is another look at fill speed and leftover space, not a new pattern that needs its own gap name.
Average days for each gap class to fill
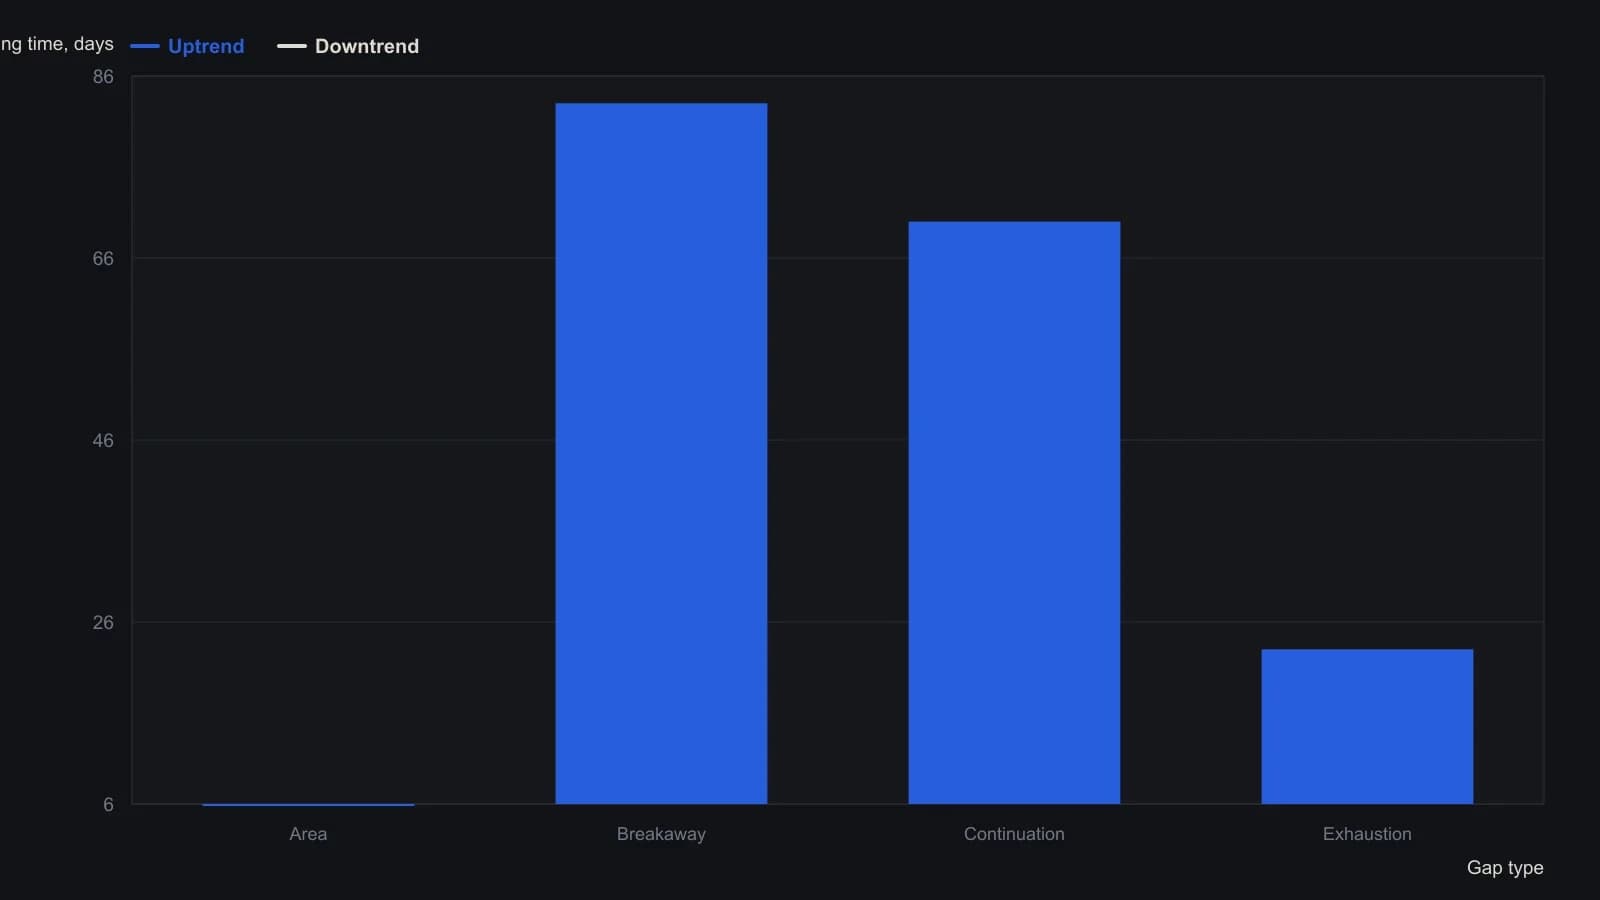
The source measured a bull-market sample and warned the figures do not describe the bear market then underway. Area gaps have a single six-day average because they form in congestion; that same value is plotted on both series.
All readings on this track · 10 readings
- 1991GM support and resistance role reversal
- 2002Evaluating throwbacks and pullbacks after triangle breakouts
- 2002Spike-shaped double bottoms as a three-gate chart drill
- 2003Constructing bullish bottom patterns from structure and confirmation
- 2003Classifying breakout gaps by fill speed and throwback
- 2006The J-hook as two gates: rounded pullback and prior-high breakout
- 2006Evaluating double tops with a throwback clock
- 2007Check duration, breakout labels, and throwback timing before rectangle measuring rules
- 2016Confirmed double-bottom, later pennant, and throwback as separate checkpoints
- 2020Late double-bottom entries after throwbacks