2016issue C1318-21
Constructing chart scale with a golden-rectangle aspect ratio
Build the chart rectangle before you read the market. Aspect ratio, pane count, and history window are construction choices that keep trend channels, candlestick form, and support-resistance geometry undistorted enough to confirm or reject.
- An unconstructed width-to-height relationship can skew trend slope, candlestick form, and indicator geometry, which produces misread technical structure.
- The construction target is a golden-rectangle aspect ratio of about 1.618 length to height, measured on the data windows rather than the price axis, with at most two indicator panes.
- Daily, weekly, and monthly history windows do different jobs: readable candlesticks, support and resistance structure, and long-horizon cycle context.
- Saving the golden-rectangle proportions as a chart template keeps the same aspect ratio when the layout moves across screen sizes.
Construct the window before the reading
Leaving a chart’s width-to-height relationship unconstructed can visually skew trend slope, candlestick form, and indicator geometry, producing misread technical structure. The first job is to build a readable rectangle, not to interpret a channel, a candlestick, or a support-resistance level on a distorted pane.
Set a golden-rectangle aspect ratio
A chart rectangle that approximates a golden-ratio length-to-height of 1.618 is the construction target for keeping trend and candlestick geometry intact. Measure that aspect ratio on the data windows, not on the price axis.
A chart template stays closer to that golden-rectangle target when it holds at most two indicator panes. Stacking additional panes compresses candles and warps trendline and indicator readings.
Match the history window to the job
Daily layouts that show about six to eight months of bars keep candlesticks readable. Longer history on the same pane compresses candles and makes indicators look more volatile than the series warrants.
A daily layout with too little history flattens the visible trend, removes usable trendline structure, and dulls indicator crossovers, divergences, and leading behavior.
Weekly templates constructed with three to four years of data are used to locate support and resistance, ranges, and topping or bottoming structure, not to read entry candlesticks.
Monthly line charts constructed with about two decades of data keep long-horizon cycle readings from looking more volatile than the underlying series. Still longer history belongs on a quarterly template so indicator formulas have enough bars.
Daily closes over a two-month window
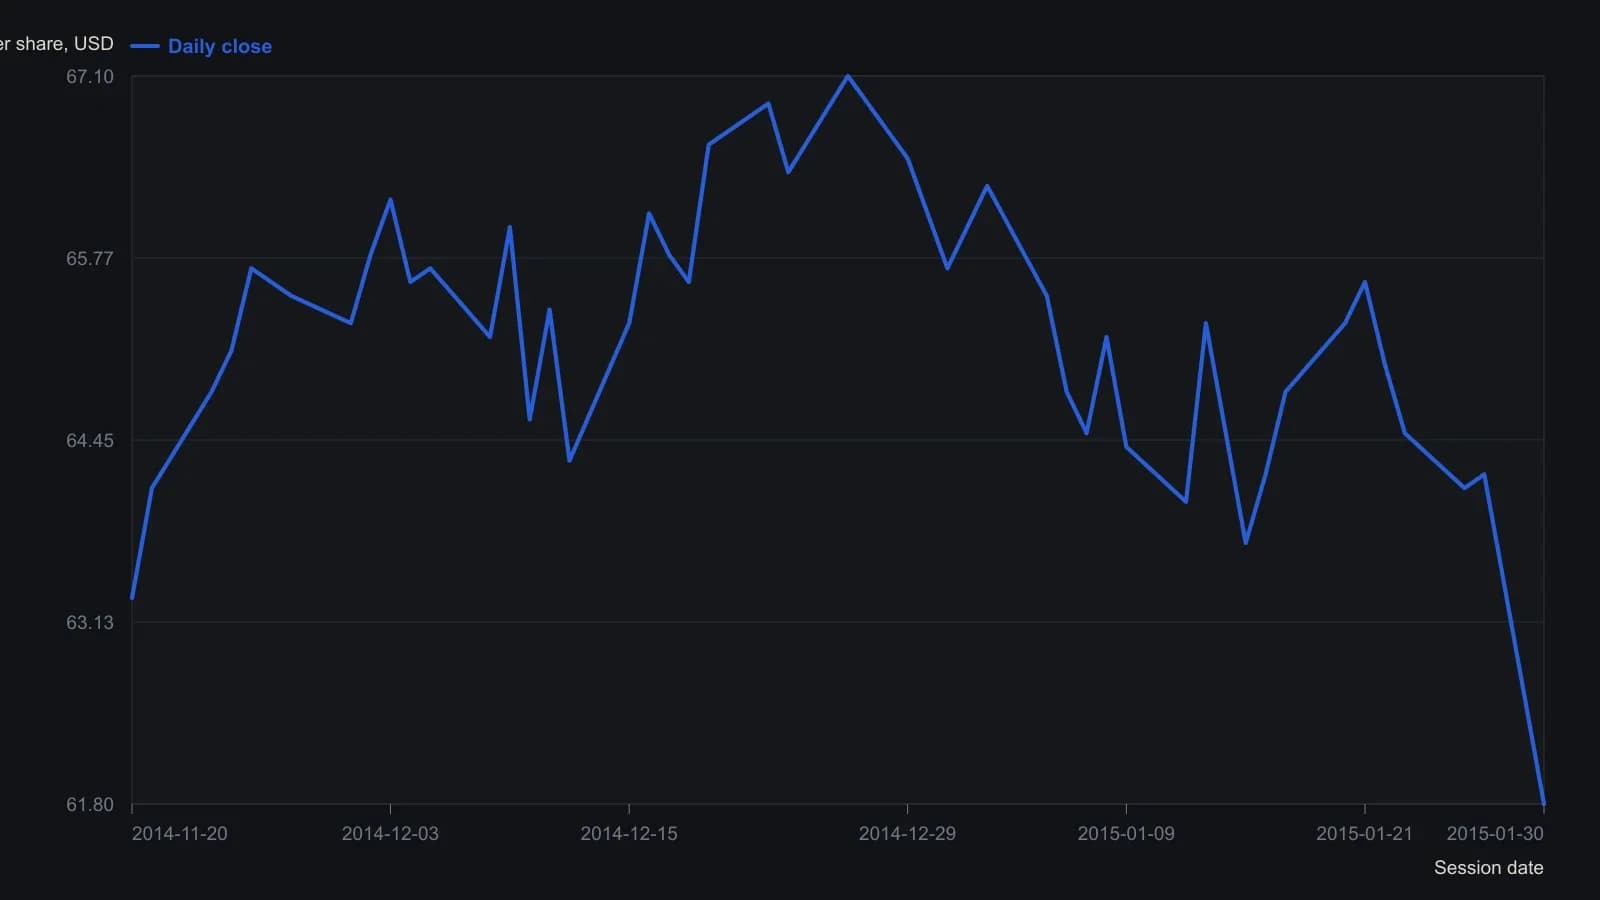
Closes are approximate to one tenth of a dollar, read from candlestick bodies on the raster rather than from a table. The printed vertical scale runs from 61.56 to 67.33. The source also draws MACD (12, 26, 9) and Bollinger %B (50, 2) in the two lower panes; those series sit on different scales and are omitted here.
Lock the construction in a template
Saving the golden-rectangle proportions as a chart template lets the same aspect ratio transfer across screen sizes without rebuilding the construction. The saved layout holds aspect ratio, pane count, and history length so the same rectangle can be reused.
All readings on this track · 14 readings
- 1982Constructing semi-log scales for trend channels
- 1988Treat a suspected bend as a construction test
- 1989Constructing percentage-box point-and-figure charts
- 1989Constructing point-and-figure objectives across chart scales
- 1991Unfinished point-and-figure until filter, scale, and pivots measure percent
- 1992A logarithmic point-and-figure construction with weekly breadth scores
- 1995Constructing a least-squares trend channel with two-standard-deviation rails
- 1995Percentage boxes turn a three-box reversal into a scale decision
- 2003Log scale trendlines and compound growth
- 2007Trendline and channel construction on linear versus log scales
- 2012Constructing trend-intensity overlays across chart scales
- 2015Index drawdown caps, chart-scale stops, and leverage
- 2016Evaluating breakouts by share-price band
- 2016Constructing chart scale with a golden-rectangle aspect ratio