1995issue C071-7
Percentage boxes turn a three-box reversal into a scale decision
Box size is part of point-and-figure signal construction. A constant 1% ladder makes a three-box reversal a percentage hypothesis and turns split or stock-dividend handling into a scale relabel instead of a redraw.
- A point-and-figure chart records direction and size of price change and does not place elapsed time on the horizontal axis.
- On a 1% logarithmic-box-scale, the number of marks in a column estimates the percentage size of the move, so a three-box-reversal is a 3% reversal.
- Traditional one-point boxes between 20 and 100, and two-point boxes above 100, create uneven percentage steps and force a full replot after a split or stock dividend.
- After a share change, prior box labels can be divided by the stock-multiplying-factor and the 1.01 ladder rebuilt from the new lowest label, keeping the existing X and O columns.
Box size is part of the signal
A point-and-figure chart is a grid of rising X columns and falling O columns. It records direction and size of price change and does not place elapsed time on the horizontal axis.
The box-value is the price assigned to one grid square. A box is marked only when price actually reaches that box-value. Prices are not rounded up or down into a box.
Editorial: the box-value is the unit of the signal. It decides when a column continues, when a three-box-reversal can fire, and what that reversal claims in percentage terms.
How a column stays or hands off
While an X column is active, additional marks come from the high and a reversal is tested against the low. While an O column is active, additional marks come from the low and a reversal is tested against the high.
The plot stays in the current column until price reaches a contrary move of three or more boxes. That three-box-reversal is the minimum contrary move, measured in boxes, required before the plot leaves the current column and starts the next one.
Column-handoff is then fixed. Each finished column has at least three marks, and the next column starts exactly one box from the prior column's last mark.
Why point boxes make an uneven hypothesis
Traditional stock box sizes that use one point between 20 and 100 and two points above 100 create uneven percentage steps.
Those fixed-point steps also make split or stock-dividend adjustment require a full replot.
A 1% ladder makes reversal a percentage rule
A logarithmic-box-scale sets each higher box equal to the box below it multiplied by 1.01, so every box is a 1% step. Each higher value is a fixed percentage step above the box below it rather than a fixed number of price points.
On a 1% box scale, the number of marks in a column estimates the percentage size of the move, so a three-box-reversal is a 3% reversal.
Editorial: the same column-handoff rule now states a percentage hypothesis. Three contrary boxes are a 3% contrary move on the chosen scale, not a changing point count.
Wausau Paper monthly high and low, February–December 1994
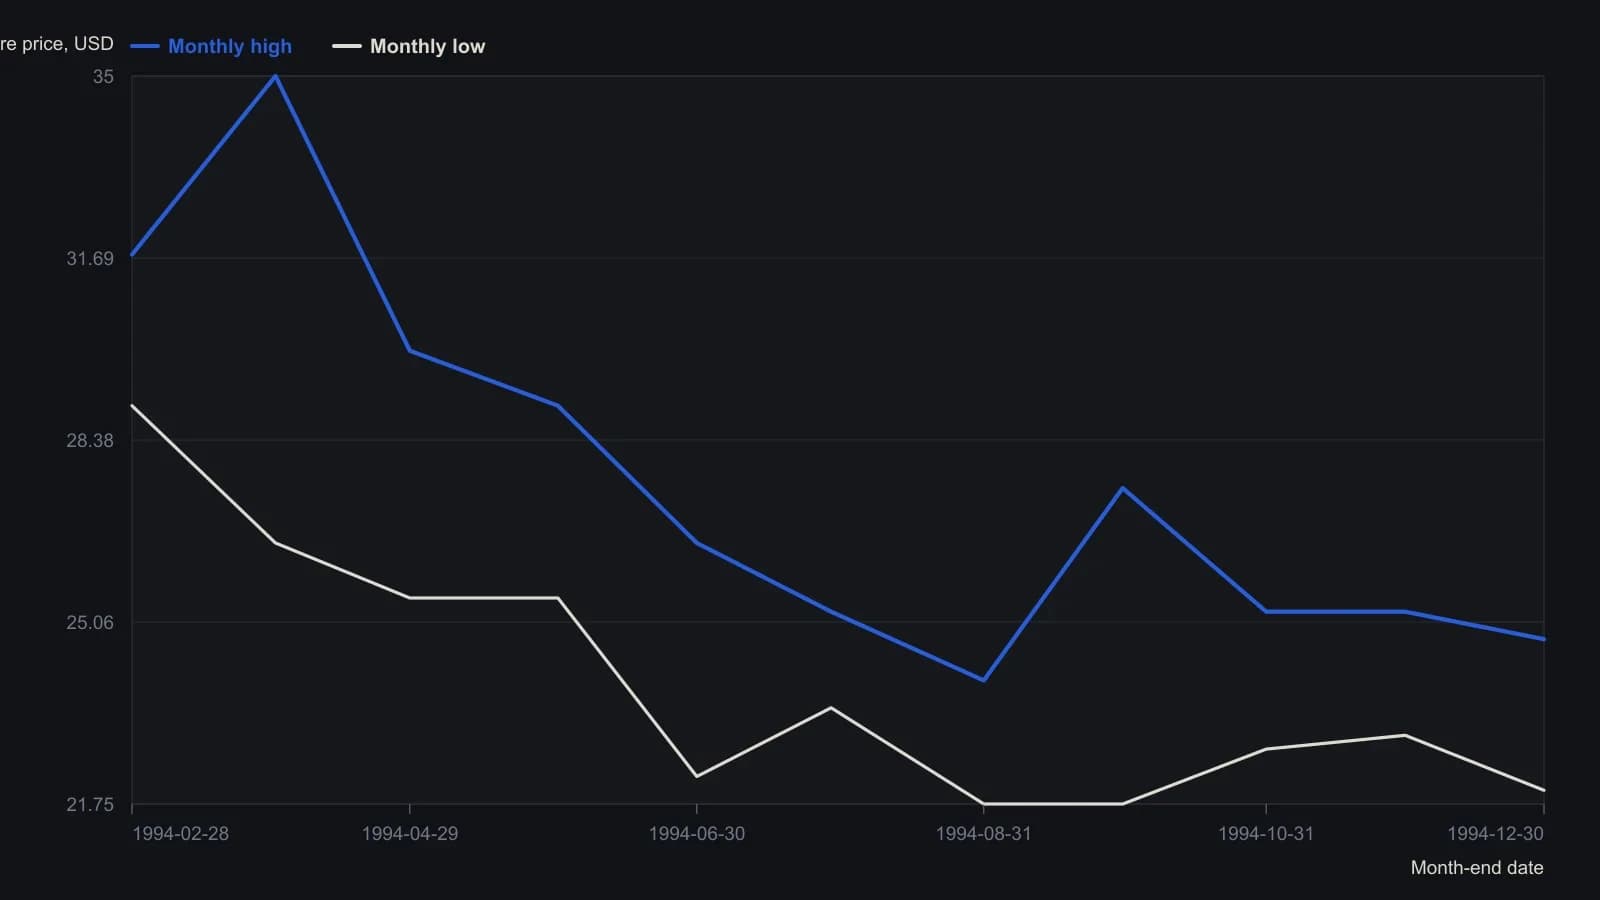
The companion log grid uses a 1.01 factor (1% per box) and a three-box reversal, so a reversal is a 3% hypothesis. Only prices that reach a box are plotted, with no rounding.
Relabel the scale after a share change
After a split or stock dividend, the existing X and O columns can be kept and only the box labels changed. Prior values are divided by the stock-multiplying-factor, which is the share-count multiplier created by the split or stock dividend. The 1.01 ladder is then rebuilt from the new lowest label.
In a 10% stock-dividend example, leaving the old scale in place extended the down column and implied a continued drop near 19%. Dividing prior box values by 1.1 turned the same later high-low print into an upward reversal of similar size.
Editorial: the share change is handled as a scale relabel, not as a redraw of the plotted structure. The later print is then read on the same percentage footing as the columns already drawn.
All readings on this track · 14 readings
- 1982Constructing semi-log scales for trend channels
- 1988Treat a suspected bend as a construction test
- 1989Constructing percentage-box point-and-figure charts
- 1989Constructing point-and-figure objectives across chart scales
- 1991Unfinished point-and-figure until filter, scale, and pivots measure percent
- 1992A logarithmic point-and-figure construction with weekly breadth scores
- 1995Constructing a least-squares trend channel with two-standard-deviation rails
- 1995Percentage boxes turn a three-box reversal into a scale decision
- 2003Log scale trendlines and compound growth
- 2007Trendline and channel construction on linear versus log scales
- 2012Constructing trend-intensity overlays across chart scales
- 2015Index drawdown caps, chart-scale stops, and leverage
- 2016Evaluating breakouts by share-price band
- 2016Constructing chart scale with a golden-rectangle aspect ratio