1992issue C101-15
A logarithmic point-and-figure construction with weekly breadth scores
Early formation study set point-and-figure aside for the line-chart, which carried more information and could sit on a logarithmic-scale. A later hybrid brought the filter back as a percentage-filter for individual names, then checked market-wide work against breadth and valuation series scored by batting-average.
- Point-and-figure was tried in early formation study and then set aside because the line-chart carried more information and could sit on a logarithmic-scale judged better for price changes.
- The later working chart for individual names kept the point-and-figure filter but posted it as a percentage-filter on a logarithmic-scale, rather than as unfiltered arithmetic boxes.
- Market-wide work was checked against the advance-decline-divergence-oscillator, odd-lot-shorts, and the price-dividends-ratio, each treated as a series that could carry a batting-average.
- Weekly opinions were scored against later market direction at one, four, 13, 26, and 52 weeks, and short tests were watched for type-one-error and type-two-error.
Why the first point-and-figure chart was set aside
Early chart study began with formations on line charts in 1930. Point-and-figure was tried and then set aside, because the line-chart carried more information and could be placed on a logarithmic-scale judged better for price changes.
Point-and-figure construction was also judged inferior because it does not express volume and because an arithmetic scale distorts trend comparison. A logarithmic-scale was preferred for trend geometry.
The later hybrid for individual names
A later hybrid kept the point-and-figure idea of filtering minor moves. It applied a percentage-filter on logarithmic charts rather than posting unfiltered arithmetic boxes. For individual names, the working construction was a logarithmic point-and-figure price chart.
How the line-chart was read
A line-chart was treated as a glance-readable map of support, resistance, and trend. Computer output was required to be seen in chart form before any decision, not accepted as an automatic buy or sell mandate.
What sat beside the price chart
Market-wide work was not left to that geometry alone. It was checked against breadth and short-interest series that had been scored by batting-average.
The advance-decline-divergence-oscillator was constructed by regressing the Dow against cumulative advance-decline totals and measuring how far the average sat ahead of or behind that line. One contemporaneous panel was labeled neutral.
Odd-lot-shorts were built as the five-day average of odd-lot shorts divided by the five-day average of odd-lot purchases plus sales. Later testing described bearish calls as poor and bullish calls as useful at 13, 26, and 52 weeks.
The price-dividends-ratio of the Dow Jones Industrial Average was used as an inflation-canceling expensiveness scale. Readings above 28 were rated expensive. A long-record map marked above 28.30 as expensive and below 18.10 as cheap. A reading as high as 35 was treated as a dangerous extreme seen only once in the prior 60 years, in 1987.
A weekly batting-average and two test errors
Indicator opinions were scored every week over a 10-year sample against subsequent market direction at one, four, 13, 26, and 52 weeks, so each series could receive a batting-average by horizon.
Two statistical construction errors were named. A type-one-error is a short test that fails to show significance that a longer test later finds. A type-two-error is a short test that reports significance that a longer test removes.
DJIA price of one dollar of dividends, 1981–1985
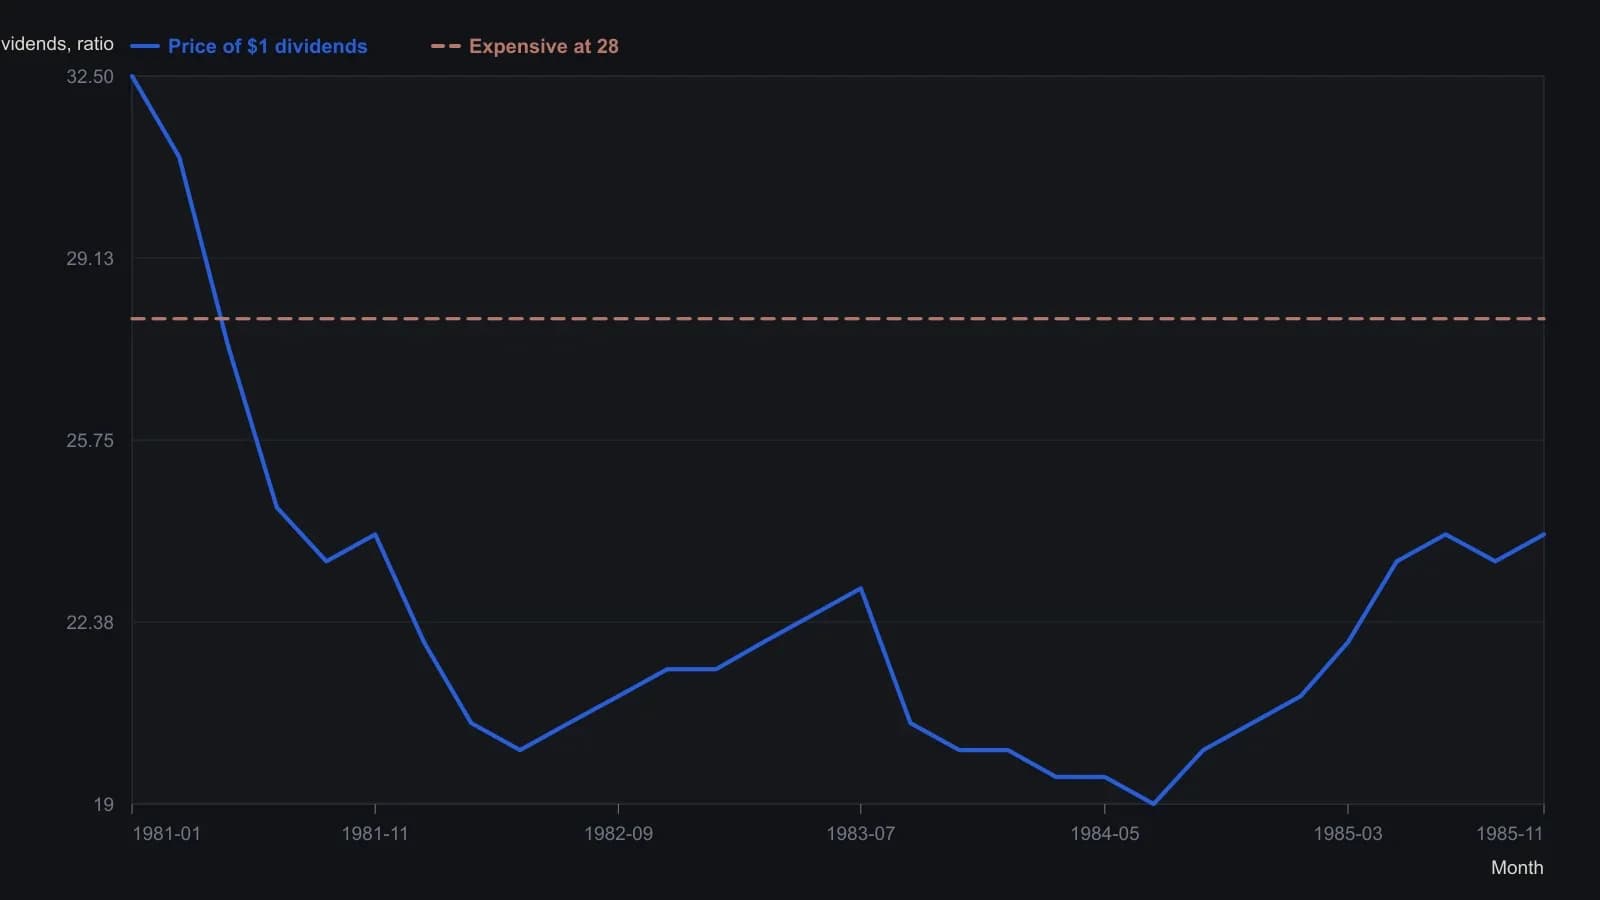
Raster is a weekly line on an arithmetic ratio scale; turning points are approximate to about one ratio point. Horizontal at 28 is the article’s expensive threshold, not a fitted average.
All readings on this track · 14 readings
- 1982Constructing semi-log scales for trend channels
- 1988Treat a suspected bend as a construction test
- 1989Constructing percentage-box point-and-figure charts
- 1989Constructing point-and-figure objectives across chart scales
- 1991Unfinished point-and-figure until filter, scale, and pivots measure percent
- 1992A logarithmic point-and-figure construction with weekly breadth scores
- 1995Constructing a least-squares trend channel with two-standard-deviation rails
- 1995Percentage boxes turn a three-box reversal into a scale decision
- 2003Log scale trendlines and compound growth
- 2007Trendline and channel construction on linear versus log scales
- 2012Constructing trend-intensity overlays across chart scales
- 2015Index drawdown caps, chart-scale stops, and leverage
- 2016Evaluating breakouts by share-price band
- 2016Constructing chart scale with a golden-rectangle aspect ratio