1991issue C101-3
Unfinished point-and-figure until filter, scale, and pivots measure percent
Conventional point-and-figure construction uses a fixed point size that does not measure relative importance. A percent-reversal-filter, a logarithmic-scale, and time-located-turning-points rebuild the worksheet so a trendline can be read as a percentage path.
- A one-point or three-point point-and-figure filter drops small swings, but a one-point move can be material at $10 and minor at $100, so a fixed-point filter does not measure relative importance.
- On an arithmetic-scale, a 5% move can be nearly invisible at low prices and look large at high prices, and a straight trendline implies a declining percentage rate of rise as price moves up the line.
- Logarithmic point-and-figure construction uses a percent-reversal-filter, a logarithmic-scale, and time-located-turning-points that stay tentative until price reverses by the chosen percent.
- After that rebuild, a trendline can be read as a percentage path across differently priced series, and earnings-multiple-bands can locate price on a simple multiple grid.
The unfinished worksheet
Conventional point-and-figure construction filters out moves smaller than a chosen point size, as in a one-point or three-point chart. A one-point move can be material for a $10 issue and minor for a $100 issue, so a fixed-point filter does not measure relative importance.
Until the reversal unit, the vertical axis, and the placement of pivots all measure the same kind of change, a drawn trendline is not yet a comparable channel across price levels.
Why an arithmetic-scale fails the chart-scale check
Chart-scale-analysis asks whether the vertical axis and the reversal unit measure the same kind of change, so a given percent occupies comparable space at high and low prices.
On an arithmetic-scale, a 5% move can be nearly invisible at low prices and look large at high prices. A constant 10% per week rise looks almost flat low on the chart and steep high on the chart.
A straight trendline on an arithmetic-scale implies a declining percentage rate of rise as price moves up the line. A logarithmic-scale places marks closer together as price rises, matching the shrinking importance of a point.
Percent filter, log scale, and time-located pivots
A logarithmic point-and-figure construction uses a percent-reversal-filter, a logarithmic-scale, and turning points placed on a time axis. Those confirmed swing pivots are time-located-turning-points, plotted at their calendar positions rather than in a time-free column grid.
A turning point cannot be finalized until price has reversed by the chosen percent. A temporary dotted or pencil segment can mark the candidate until that confirmation.
An illustrated construction used a 10% price filter so moves smaller than 10% were omitted, with a logarithmic vertical scale so vertical distance represented percentage change.
Trendlines and earnings-multiple-bands after the rebuild
After that rebuild, trendlines can be read as percentage paths, and charts of differently priced stocks or averages can be compared without point-scale distortion. A straight line across confirmed pivots is then a more stable percentage path than the same line on an arithmetic chart.
Horizontal lines equal to trailing-year earnings times fixed multiples such as 10, 20, or 30 locate price on an approximate price-to-earnings grid. Each line is an earnings-multiple-band. A path midway between the 20-times and 30-times lines corresponds to a ratio near 25.
Merry Go Round Enterprises, 10% reversal filter
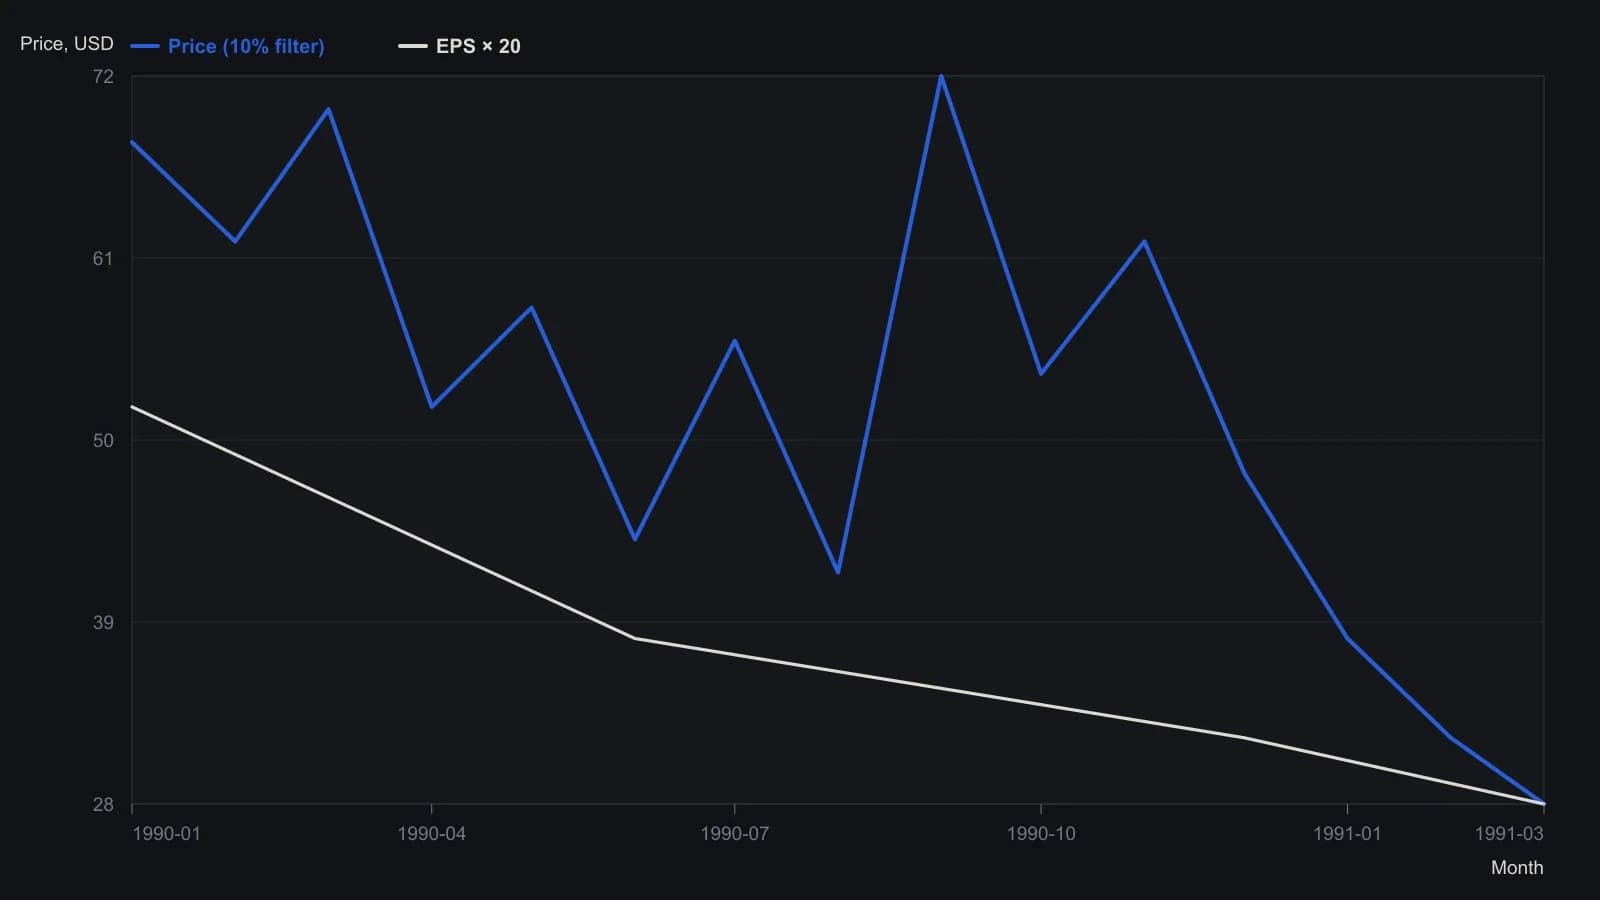
Source uses a 10% price filter and a log price scale; turning points stay dotted until a 10% pullback confirms them. Digitized from the printed figure, so levels are approximate.
All readings on this track · 14 readings
- 1982Constructing semi-log scales for trend channels
- 1988Treat a suspected bend as a construction test
- 1989Constructing percentage-box point-and-figure charts
- 1989Constructing point-and-figure objectives across chart scales
- 1991Unfinished point-and-figure until filter, scale, and pivots measure percent
- 1992A logarithmic point-and-figure construction with weekly breadth scores
- 1995Constructing a least-squares trend channel with two-standard-deviation rails
- 1995Percentage boxes turn a three-box reversal into a scale decision
- 2003Log scale trendlines and compound growth
- 2007Trendline and channel construction on linear versus log scales
- 2012Constructing trend-intensity overlays across chart scales
- 2015Index drawdown caps, chart-scale stops, and leverage
- 2016Evaluating breakouts by share-price band
- 2016Constructing chart scale with a golden-rectangle aspect ratio