2015issue C088-11
Index drawdown caps, chart-scale stops, and leverage
The case record treats pre-entry risk as one envelope: index-drawdown rules cap how much cash may enter, chart-scale launch and support lines define where the idea is false, and a Fibonacci-looking dip is not allowed to enlarge size or delay the stop.
- Index-drawdown sizing left new-trade allocation unchanged until the index was 20 percent below its peak, then halved the dollar amount for every further 10 percent decline, and then reduced size again for market and stock volatility.
- Chart-scale analysis used 2014 resistance, a support band, candle C, and launch point A to set a target near 49 and a failure zone just above the launch near 42, then required an exit on a close below candle B.
- After a winning streak, a currency episode treated the first down day as a normal Fibonacci retracement while scaling from a 5250 outlay to 13 pound-dollar contracts, and was stopped out two days later for a 28600 loss against a prior largest loss of 2700.
- The case treats post-streak certainty as a reason to keep a swing stop tight rather than giving the position extra time because the outcome feels assured.
One envelope before the order
The case record builds pre-entry risk as one envelope rather than as separate afterthoughts. Index-drawdown sizing caps how much cash may enter a new trade. Chart-scale analysis sets the launch price, the failure zone, and the stop on the same scale as the idea. A Fibonacci-looking dip is not used to enlarge size or to delay that stop.
Leverage-control is a rule that shrinks allocated capital as index drawdown, volatility, or contract notional would otherwise let one loss threaten the account. In this workflow that rule sits in front of the chart reading, not after it.
Index-drawdown sizing
Index-drawdown sizing left new-trade allocation unchanged until the index was 20 percent below its peak, then halved the dollar amount allocated to each trade for every further 10 percent index decline, and then reduced size again for market and stock volatility.
The worked allocation started at 20000 per trade, stayed there when the index was less than 20 percent off its high, fell to 10000 at a 20 percent drawdown, and fell to 5000 at a 30 percent drawdown.
After shrinking size, the same account could hold about 30 names with two or three stocks sharing an industry. The case cites that cash-per-name choice as tighter than an eight-name, 85 percent diversification figure.
Hold-horizon shift
Hold-horizon shift is moving among swing, position, and multi-year holds so a thesis is not forced into a short-duration, high-turnover frame. In the case record, median hold time excluding day trades was 93 days, and holds longer than that produced larger percentage outcomes than shorter holds.
The largest percentage outcomes in the longer-term sample were associated with holds of about three to four years. The early large-percentage holdings lasted about 2.5 years rather than completing inside one year.
Editorial interpretation: those hold times show why the stop and the size envelope should match the intended horizon. They are not a claim that longer holds are preferable.
Chart-scale launch and failure
Chart-scale analysis is reading highs, lows, support, resistance, and launch prices on the same price scale to set a target, a failure zone, and a stop before the order is placed. A launch-price is the breakout from congestion that starts a straight-line run. A failed run is treated as likely to stall just above that level, not at it.
On the utility-sector fund chart, 2014 overhead resistance, a support band, a bounce candle at C, and a launch point at A were used to set a target near 49 and a failure zone just above the launch near 42.
The swing entry filled at 46.10 the session after candle C. A mental stop required an exit if the fund closed below the low of candle B. That close occurred at D and the next-open fill was 44.33, a 3.9 percent loss.
A Fibonacci dip that enlarged size
Fibonacci retracement is a chart reading that treats a pullback as a normal retrace rather than as invalidation, which can postpone an exit if it is not paired with a separate size and stop cap.
After a run of winning trades, the currency case scaled from a prior largest outlay of 5250 to 13 pound-dollar contracts notionally 1.3 million. It treated the first down day as a normal Fibonacci retracement and was stopped out two days later for a 28600 loss versus a prior largest loss of 2700.
The case treats post-streak certainty as a reason to keep a swing stop tight rather than giving the position extra time because the outcome feels assured.
XLU swing stopped under the chart-scale support shelf
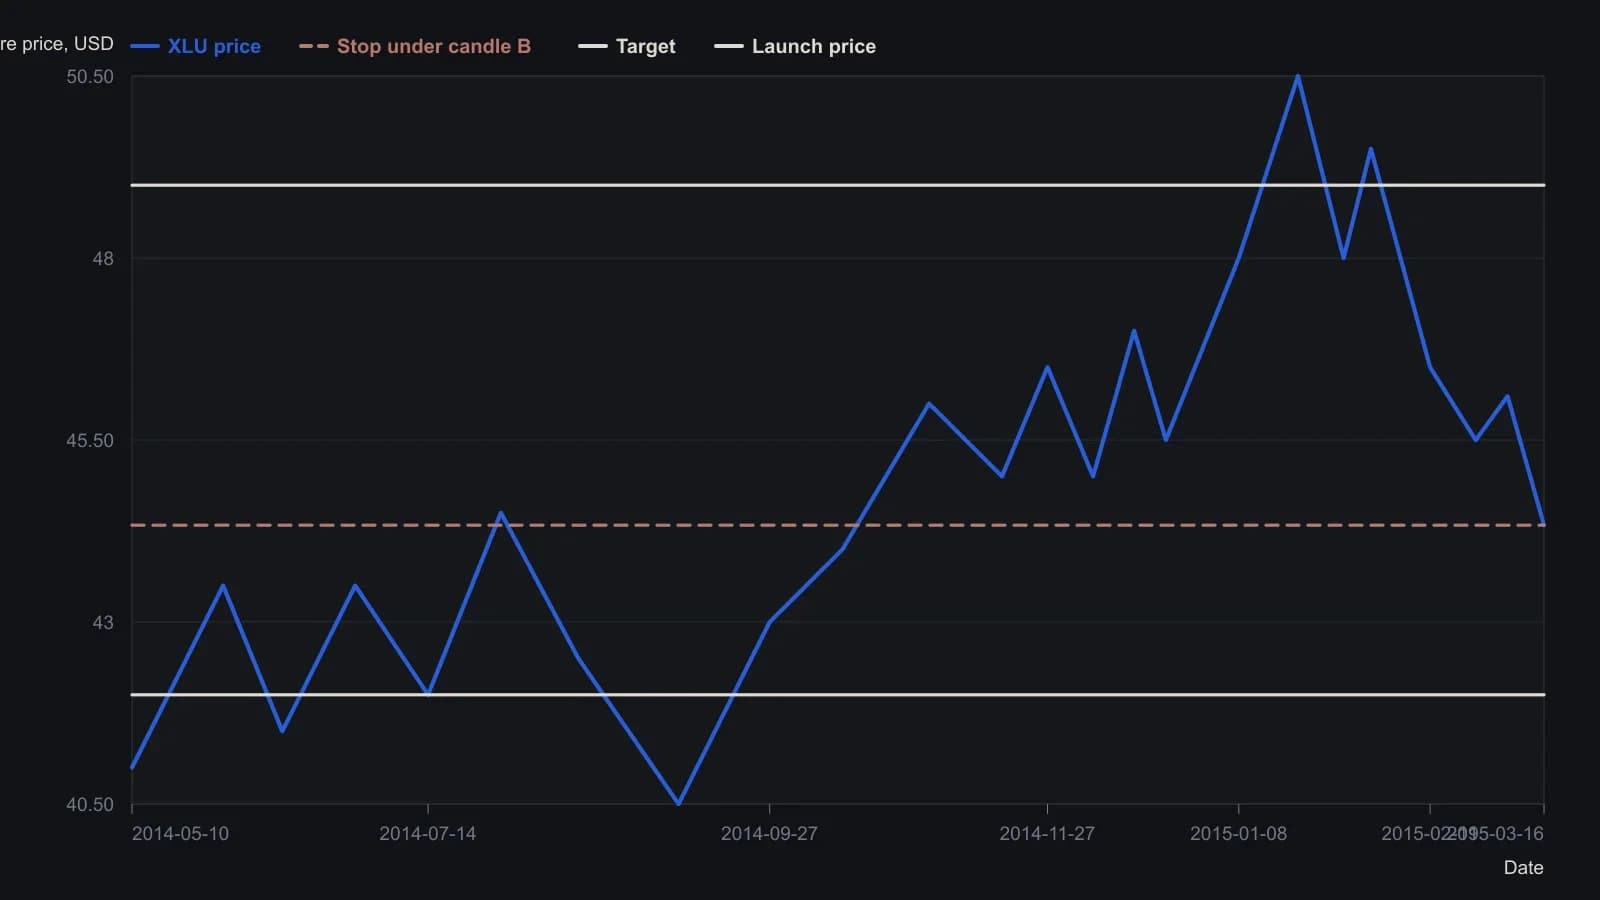
The extract of Figure 1 has no tick numerals on the plot itself. Dollar scale 39–50 and the May 2014–March 2015 axis come from the published figure; candles are read to the nearest half dollar. Stated fills stay at the article’s cents. Dates of swings follow visual position on that axis and are approximate.
All readings on this track · 14 readings
- 1982Constructing semi-log scales for trend channels
- 1988Treat a suspected bend as a construction test
- 1989Constructing percentage-box point-and-figure charts
- 1989Constructing point-and-figure objectives across chart scales
- 1991Unfinished point-and-figure until filter, scale, and pivots measure percent
- 1992A logarithmic point-and-figure construction with weekly breadth scores
- 1995Constructing a least-squares trend channel with two-standard-deviation rails
- 1995Percentage boxes turn a three-box reversal into a scale decision
- 2003Log scale trendlines and compound growth
- 2007Trendline and channel construction on linear versus log scales
- 2012Constructing trend-intensity overlays across chart scales
- 2015Index drawdown caps, chart-scale stops, and leverage
- 2016Evaluating breakouts by share-price band
- 2016Constructing chart scale with a golden-rectangle aspect ratio