1998issue C081-4
Constructing a stock-book duration proxy from beta and bond markets
A stock book's interest-rate sensitivity can be assembled as a duration-proxy from portfolio-beta, bond-market duration, the historical-volatility ratio of equities to bonds, and intermarket-correlation. The construction does not require a forecast of the equity payment stream.
- Classical duration from an equity dividend or earnings stream is blocked by unknown future payments, disputed discount rates, and payment streams that can change when rates move.
- The duration-proxy multiplies portfolio-beta by bond-market duration, the equity-to-bond historical-volatility ratio, and intermarket-correlation, reusing conventional asset-allocation variance and correlation inputs.
- The construction is specified to use recent or anticipated volatilities and correlations as ex-ante-inputs rather than only long-term averages, and those chosen inputs remain subjective.
- Beta-hedging raises or lowers the constructed duration by changing portfolio-beta. Interest-rate sensitivity is only one risk on a stock book, and the proxy is described as most informative when rate moves are substantial.
Why equity cash flows block classical duration
Duration is treated as a rate-sensitivity measure in which a five-year figure implies about a 5 percent value change for a one-percentage-point interest-rate move, and a 10-year duration is twice as sensitive as a five-year duration.
Computing classical duration from an equity dividend or earnings stream is obstructed by unknown future payments, disagreement over which rates to use for discounting, and the fact that rate moves can themselves change the payment stream.
Assembling the duration-proxy
A duration-proxy is a constructed interest-rate sensitivity for a stock portfolio, stated in years. It is built as portfolio-beta times bond-market duration times the ratio of equity-market to bond-market return volatility times the equity-bond return correlation.
That construction reuses the variance and correlation inputs of conventional asset allocation, applied to a broad equity gauge, a broad bond gauge, and the portfolio's current beta. Portfolio-beta is the current sensitivity of the stock book to broad equity-market moves and is the construction's adjustable scale factor. Historical-volatility is the trailing realized standard deviation of market returns, used as the equity-to-bond volatility ratio inside the duration construction. Intermarket-correlation is the correlation of equity-index and bond-index returns, which determines how much bond-market duration transfers to the stock book.
A trailing-window illustration
In a January 1993 through March 1998 illustration using trailing 12-month monthly-return statistics, average bond-market volatility was 1.30, average equity-market volatility was 2.90, and average equity-bond correlation was +0.55. Combining those averages with a portfolio-beta of 0.95 and a bond-index duration of 5.39 years produced a 6.3-year duration-proxy, read in the example as about a 6.3 percent value change for a one-percentage-point interest-rate move.
Over the same window, trailing 12-month equity volatility ranged from 1.50 percent to 4.98 percent while bond-market volatility stayed near 1.30 percent. Trailing 12-month equity-bond correlation ranged from +0.10 to +0.87 with multi-month trend episodes.
Ex-ante-inputs and beta-hedging
The duration construction is specified to use recent or anticipated volatilities and correlations rather than only long-term historical averages. Those ex-ante-inputs remain subjective.
The constructed sensitivity can be raised or lowered by changing portfolio-beta. That adjustment is beta-hedging. If equity and bond volatilities are equal, returns are perfectly correlated, and beta is 1.0, the stock duration equals the bond-index duration.
Interest-rate sensitivity is only one of several risks affecting a stock book. The proxy is described as most informative when rate moves are substantial.
Trailing 12-month volatility of equity and bond returns
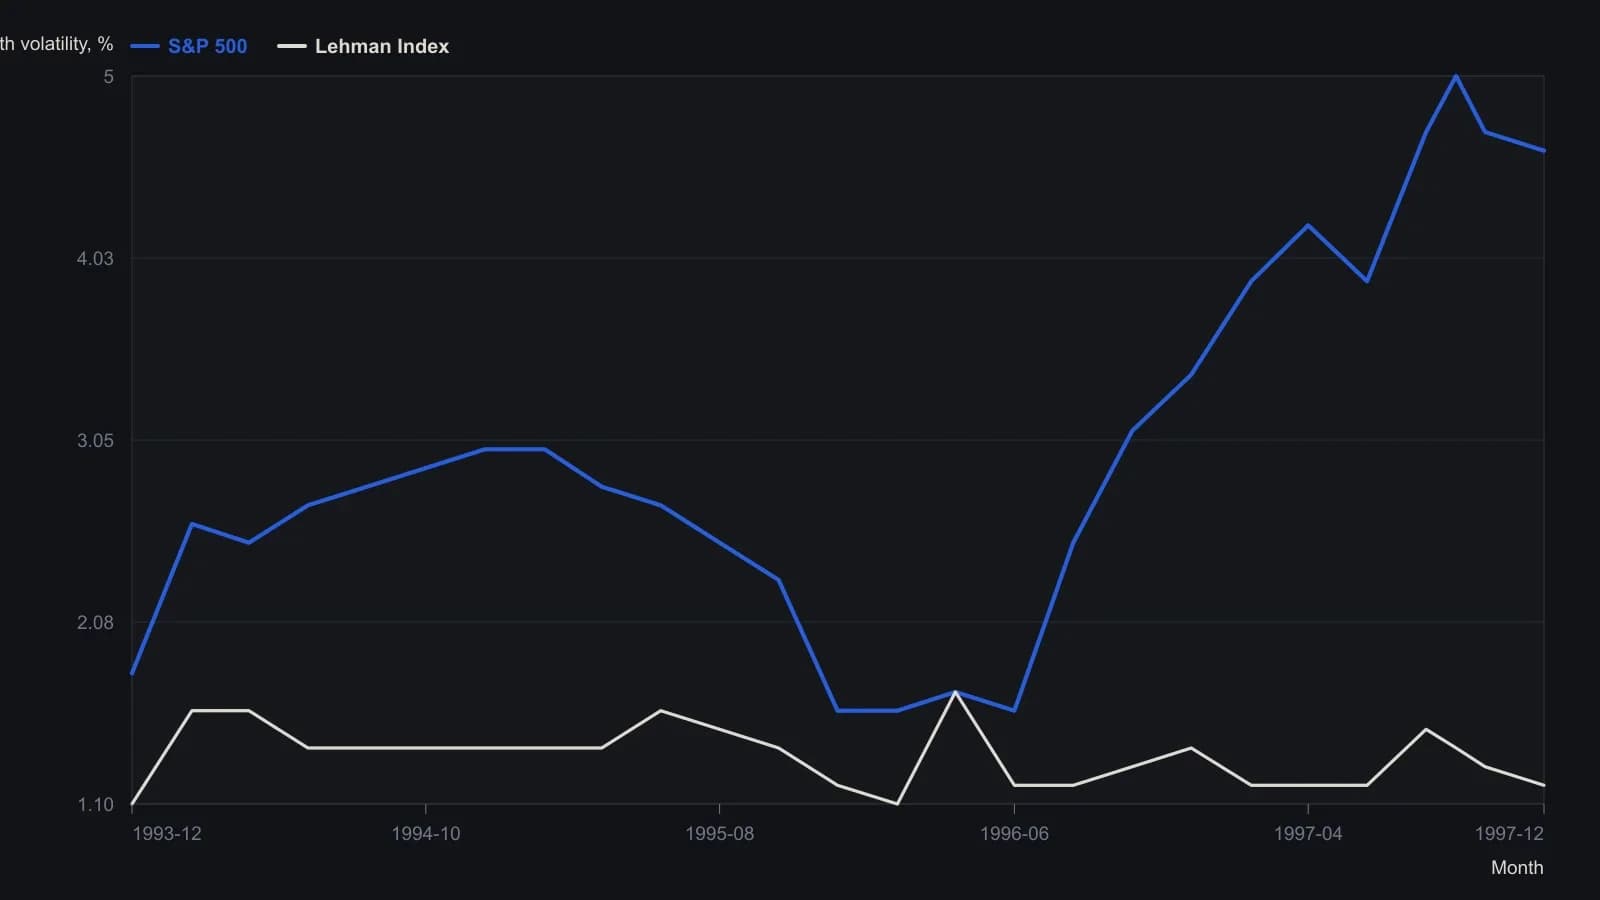
Approximate raster readings at a two-month step (plus the late-1997 peak). Arrington states sample averages of 2.90% for equities (range 1.50–4.98) and about 1.30% for bonds, from a trailing 12-month standard deviation of monthly returns.
All readings on this track · 13 readings
- 1989Rank rotation opens the names; pairing keeps the hedge
- 1991Evaluating allocation sleeves against an index proxy
- 1991Construct an equity book by weakening residual co-movement, then setting a market slope
- 1992Sizing index futures to retarget portfolio beta
- 1992Portfolio beta overlays with index futures and puts
- 1997Construct a trailing stop from beta and price
- 1998An offense-defense matrix for regime-aware stock selection
- 1998Constructing a stock-book duration proxy from beta and bond markets
- 2007An index put as deductible insurance for an active stock book
- 2010Constructing option overlays for beta-adjusted portfolios
- 2014Long-only relative value with an index hedge and a crisis stop
- 2017Hedging a rising book with beta and ATR
- 2019Sizing micro index futures overlays for cash equity books