1997issue C011-6
Construct a trailing stop from beta and price
This archive workflow kept the entry indicator independent of the exit and sized a Trailing stop from beta and price so ordinary daily range was less likely to force a sale. Once set, that stop could only be raised.
- Buy and sell decisions can be constructed separately, with the entry indicator kept independent of a beta-adjusted Trailing stop used to exit.
- The major Stop-loss order table widened allowed percentages as beta rose, from 8% up to 14%, and a second price layer gave lower-priced names more room.
- A worked mapping of 16% was preferred to a tighter 8% to 10% distance, which was described as more likely to exit on ordinary daily range.
- The Trailing stop was based on the high and could only be raised, so tested exits averaged a smaller loss than the computed stop percentage.
Separate the sell from the buy
Buy and sell decisions can be constructed separately, with an entry indicator kept independent of a beta-adjusted Trailing stop used to exit.
The archive problem on the exit side was to choose a Stop-loss order distance and then trail it. The buy rule was not used to set that distance.
Read beta before choosing a stop distance
A stock beta of 1.50 is described as tending to rise or fall 50% more than the comparison index used to compute that beta. TradersWeek editorial reading: that index comparison is the Beta hedging step in this construction, putting a single name into a relative-move context before the stop is sized.
A frequency count of 224 stocks was grouped into beta bins of about 0.2, spanning from 0.4 and below through above 1.8, after observed betas ranged from 0.35 to 2.0. Most names in that sample sat above a beta of 1.0, with the largest single bin at 1.01 to 1.2 containing 57 stocks, and higher-beta groups showing larger average declines.
Build a major table, then a price table
The major Stop-loss order table was formed by averaging daily percent-down moves within each beta bin, multiplying those averages by 5, then making a small performance adjustment so higher-beta bins received wider percentages from 8% up to 14%.
A second, price-based adjustment layer was added because lower-priced stocks were treated as more volatile than higher-priced stocks and therefore needed larger stop percentages. Empty or inconsistent cells in the price-adjustment grid were filled by averaging neighboring values to produce a usable minor table for testing alongside the major table.
Keep the trailing stop only able to tighten
In a worked example, a stock with beta 1.65 and a high of 28 1/8 mapped to a 16% stop, and tightening that distance to 8% to 10% was described as raising the chance of an exit on ordinary daily range.
At the sample averages of beta 1.20 and price 30.23 the tables produced a 12% computed stop, while tested exits averaged about a 10% loss because the stop was based on the high, execution waited until the day after a close through the level, and the Trailing stop was only raised, never lowered.
TradersWeek editorial reading: once the distance is wide enough that everyday range should not trigger the sale, the remaining rule is one-way. The stop may tighten as the high advances and is not moved lower.
Acclaim Entertainment price and 20-day average, 1995
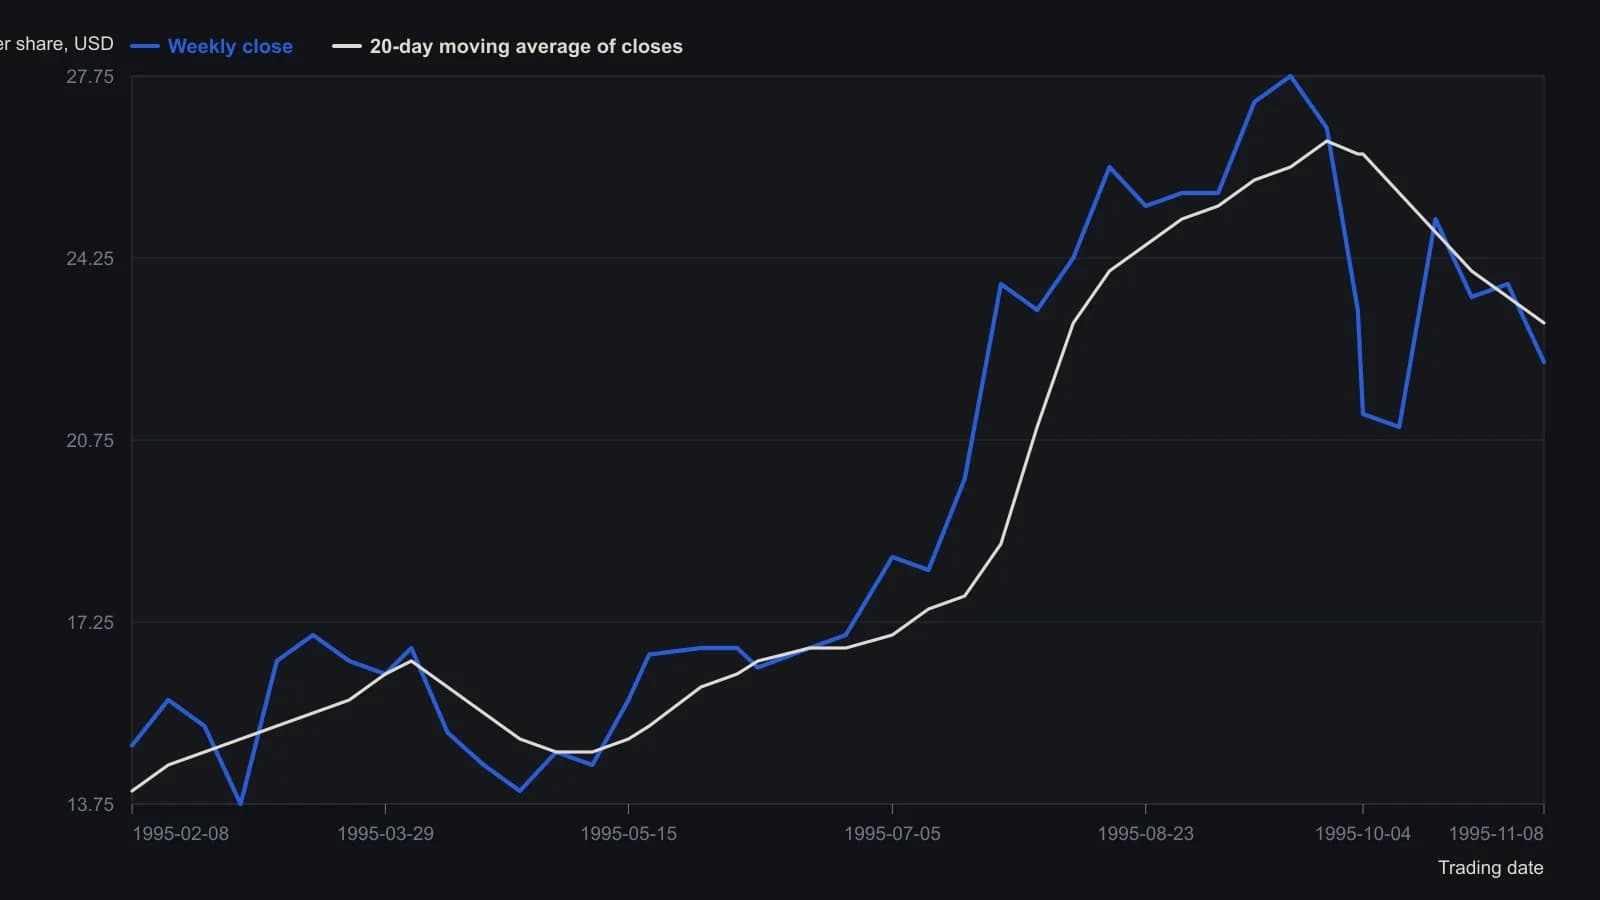
Sampled about weekly from the raster to the nearest quarter-dollar, except trade dates taken from the article. The overlay is the 20-day average of closes drawn on the source chart, not the high/low averages used in the compared system.
All readings on this track · 13 readings
- 1989Rank rotation opens the names; pairing keeps the hedge
- 1991Evaluating allocation sleeves against an index proxy
- 1991Construct an equity book by weakening residual co-movement, then setting a market slope
- 1992Sizing index futures to retarget portfolio beta
- 1992Portfolio beta overlays with index futures and puts
- 1997Construct a trailing stop from beta and price
- 1998An offense-defense matrix for regime-aware stock selection
- 1998Constructing a stock-book duration proxy from beta and bond markets
- 2007An index put as deductible insurance for an active stock book
- 2010Constructing option overlays for beta-adjusted portfolios
- 2014Long-only relative value with an index hedge and a crisis stop
- 2017Hedging a rising book with beta and ATR
- 2019Sizing micro index futures overlays for cash equity books