2001issue C101-4
When beta hedging misreads portfolio volatility
Historical beta describes how a name or book already moved with a broad index. Using that slope to add or offset market exposure can still leave most of a book's swings unexplained. A fit score and an alpha residual show when the hedge is describing the last regime instead of governing the next one.
- Systematic risk is the market-wide exposure accepted by holding equities rather than a guaranteed-return instrument, while unsystematic risk is company-specific variability that can overwhelm a single-name beta.
- Beta hedging uses a historical slope versus a broad index to judge how much market-wide risk a trade adds or offsets, but that slope is unstable for individual names and a weak estimator of future volatility.
- R-squared reports how much of a name or fund's variation the same index accounts for, and the alpha coefficient checks what a lone beta reading leaves unexplained.
- A shorter horizon leaves an investor more exposed to one adverse market move, while a longer horizon can make the same systematic exposure less central even as a larger dollar amount sits at risk.
What historical beta measures
Market-wide systematic risk is distinguished from company-specific unsystematic risk. Accepting systematic risk is presented as the cost of seeking equity outcomes instead of holding an instrument with a guaranteed return.
Beta is the regression slope of a security's value change versus the S&P 500. A coefficient of 1.3 implies an expected 13 percent move when the index rises 10 percent and a decline of a little more than 19 percent when the index falls 15 percent.
Beta hedging uses a security's or book's historical slope versus a broad index to judge how much market-wide risk a trade adds or offsets. Adding a 1.5-beta name to a 1.1-beta equity book raises the book's measured risk in proportion to the trade's weight. The coefficient can lose meaning when the book is not fully allocated to equities.
Historical beta is described as unstable for individual names and a weak estimator of future volatility. It remains useful as a description of the past variability a purchaser is taking on. Unsystematic risk can overwhelm a single-name beta and make that slope a poor stand-in for the next move.
Snapshot betas of extreme names versus the S&P 500, 6 June 2001
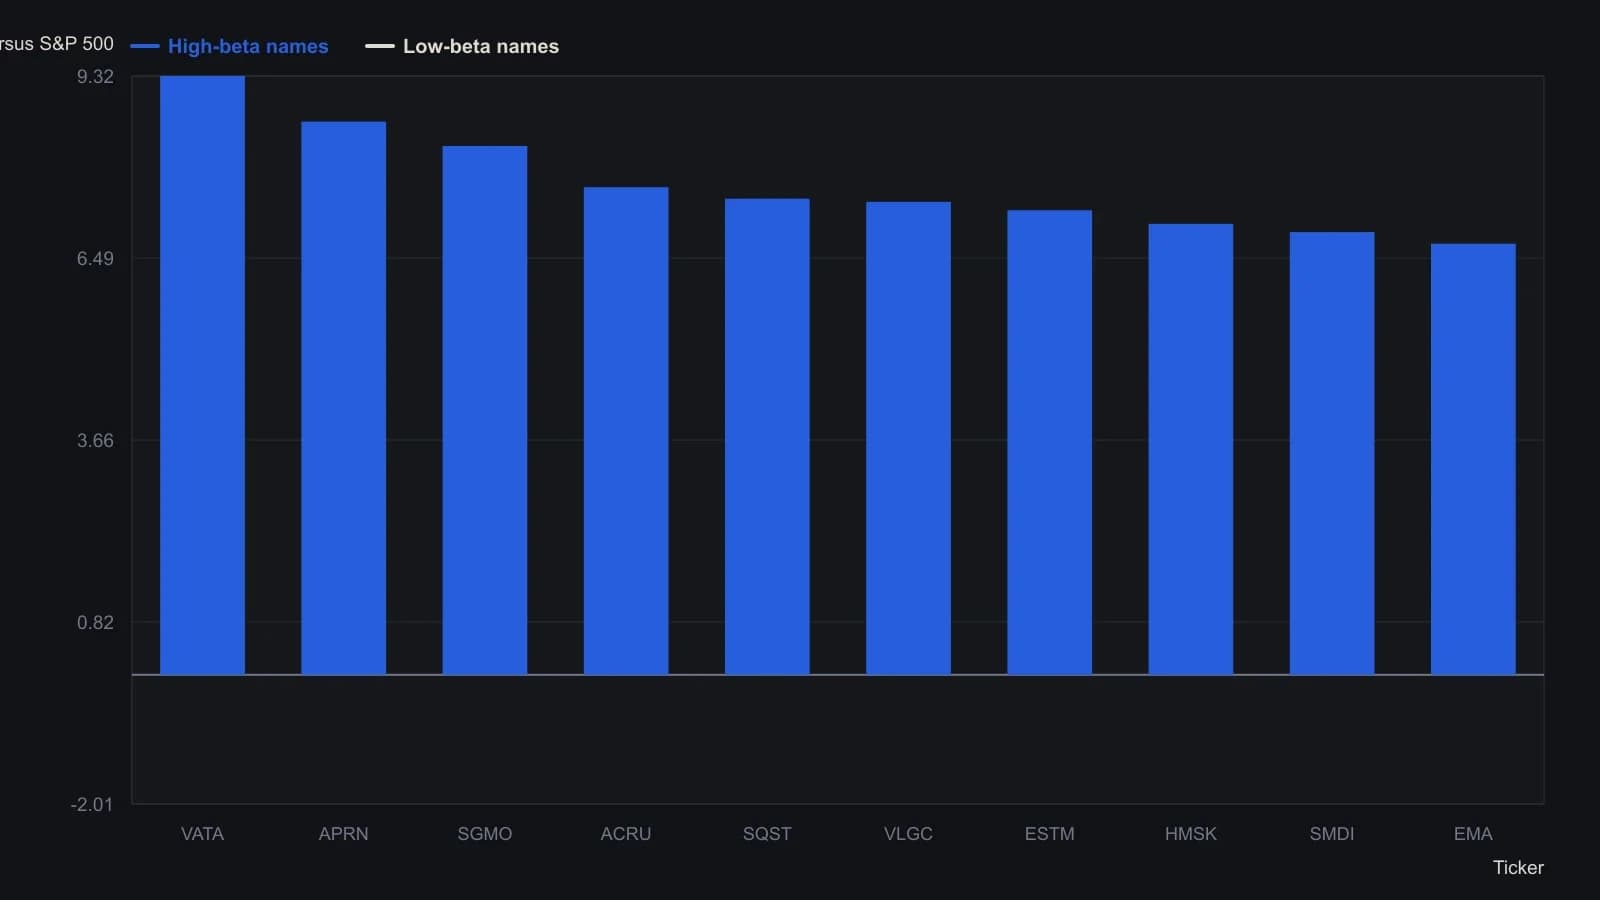
These are contemporaneous individual-stock betas versus the S&P 500 on 6 June 2001. The article itself treats single-name beta as unstable and a poor estimator of future volatility.
What a lone slope leaves unexplained
R-squared, scaled from 0 to 1, reports how much of a name or fund's variation is explained by the S&P 500. A reading of 0.9 means 90 percent of that variation is accounted for by the index. A pure index fund would be expected to score 1.
The alpha coefficient is used alongside standard deviation and Sharpe-style ratios as a residual check on whether a return premium remained after the risk taken. It is a snapshot of whether a name or book earned more or less than the return implied by its market-relative risk, and a check on what a lone beta reading leaves unexplained.
Price volatility is treated as two-sided deviation from a mean and as a source of uncertainty tied to expected excess return over a risk-free rate. It is distinct from earnings variability. Historical volatility describes the past price variability of a name or book, including those two-sided deviations and market-relative swings, and is used to describe the regime already experienced rather than to promise a future path. Whether that uncertainty is helpful depends on the investor's goals.
Commentators treated beta as overused and incomplete. They cited a finding of no historical link between a set of stock returns and their betas. They judged ordinary standard deviation and beta sufficient for most people among a much larger menu of volatility statistics.
Horizon and systematic exposure
A shorter horizon leaves an investor more exposed to one adverse market move, while a longer horizon can make that same systematic exposure less central. Time-diversification is the claim that longer horizons shrink the chance of a percentage loss even while a larger dollar amount sits at risk. Over longer horizons the chance of a percentage loss can decline even as the dollar amount at risk grows, which is one reason allocations may later shift toward less volatile instruments after large gains or as a goal date nears.