Semiconductor Index SOX Logs Crisis-Level Volatility in July with 2% Intraday Swings All 22 Days
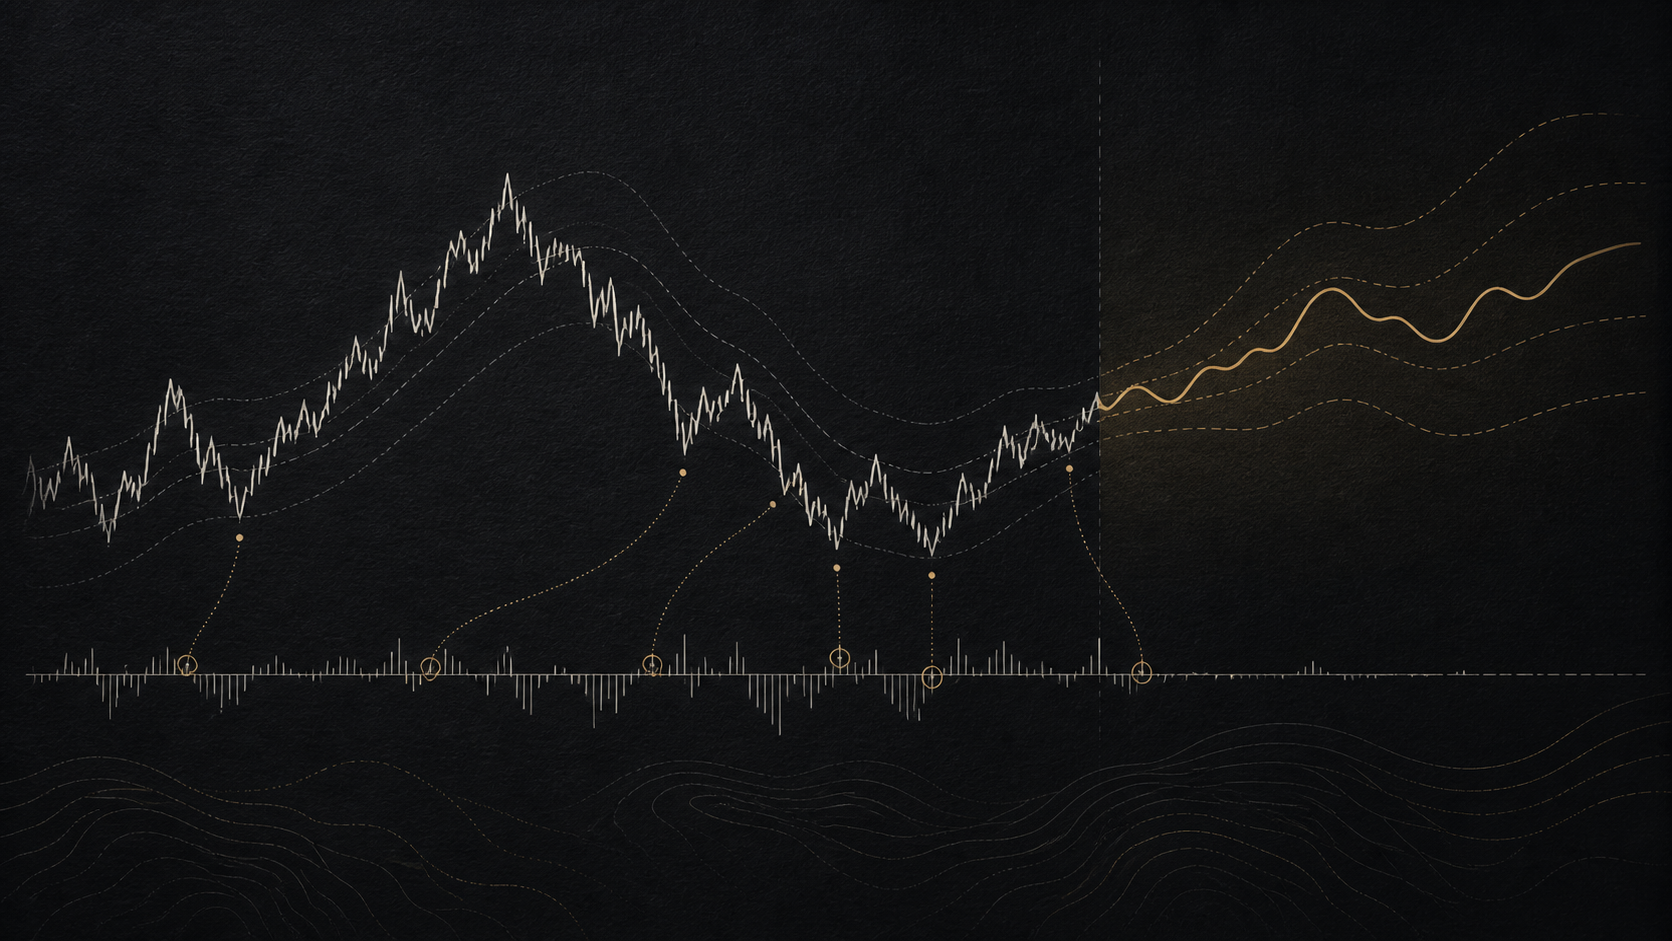
The Philadelphia Semiconductor Index saw 2%+ intraday swings every trading day in July, matching a streak last seen in 2020 and the 2008 crisis. SOX plunged 21% in the month, erasing $2.2 trillion in market cap.
The Philadelphia Semiconductor Index ($SOX) experienced extreme turbulence in July, with all 22 trading days registering an intraday swing of at least 2%. This streak matches a similar run in 2020 and was previously seen only during the 2008 financial crisis.
The index tumbled 21% in July, its worst monthly performance since October 2008, wiping out $2.2 trillion in market capitalization.
As a result, 60-day realized volatility surged to around 66%, the highest since the pandemic era when it peaked near 85%. By comparison, volatility reached approximately 75% during the 2008 crisis.
The data highlight crisis-like conditions in semiconductor stocks, a sector often viewed as a bellwether for global tech demand.
Source: The Kobeissi Letter