US stocks: technical analysis for 15 names and a sector heatmap
/analysis now covers 13 US stocks and two ETFs with the same consensus verdict we give crypto, recomputed every 15 minutes. And /heatmap/stocks lays US names out by sector, sized by turnover and coloured by the move.
Technical analysis for US stocks
The /analysis pages that give crypto a consensus verdict now cover 15 US names: TSLA, NVDA, AAPL, MSFT, AMZN, GOOGL, META, AMD, AVGO, INTC, PLTR, COIN and MSTR, plus the SPY and QQQ ETFs. Each page carries the 123-indicator barometer, pivots and structural levels on three timeframes, recomputed every 15 minutes.
The data comes from 24/7 perpetual contracts on these stocks, not from the exchange-listed shares, and every page says so, along with where the US session is right now. Related links at the bottom stay within the same asset class.
A heatmap by sector
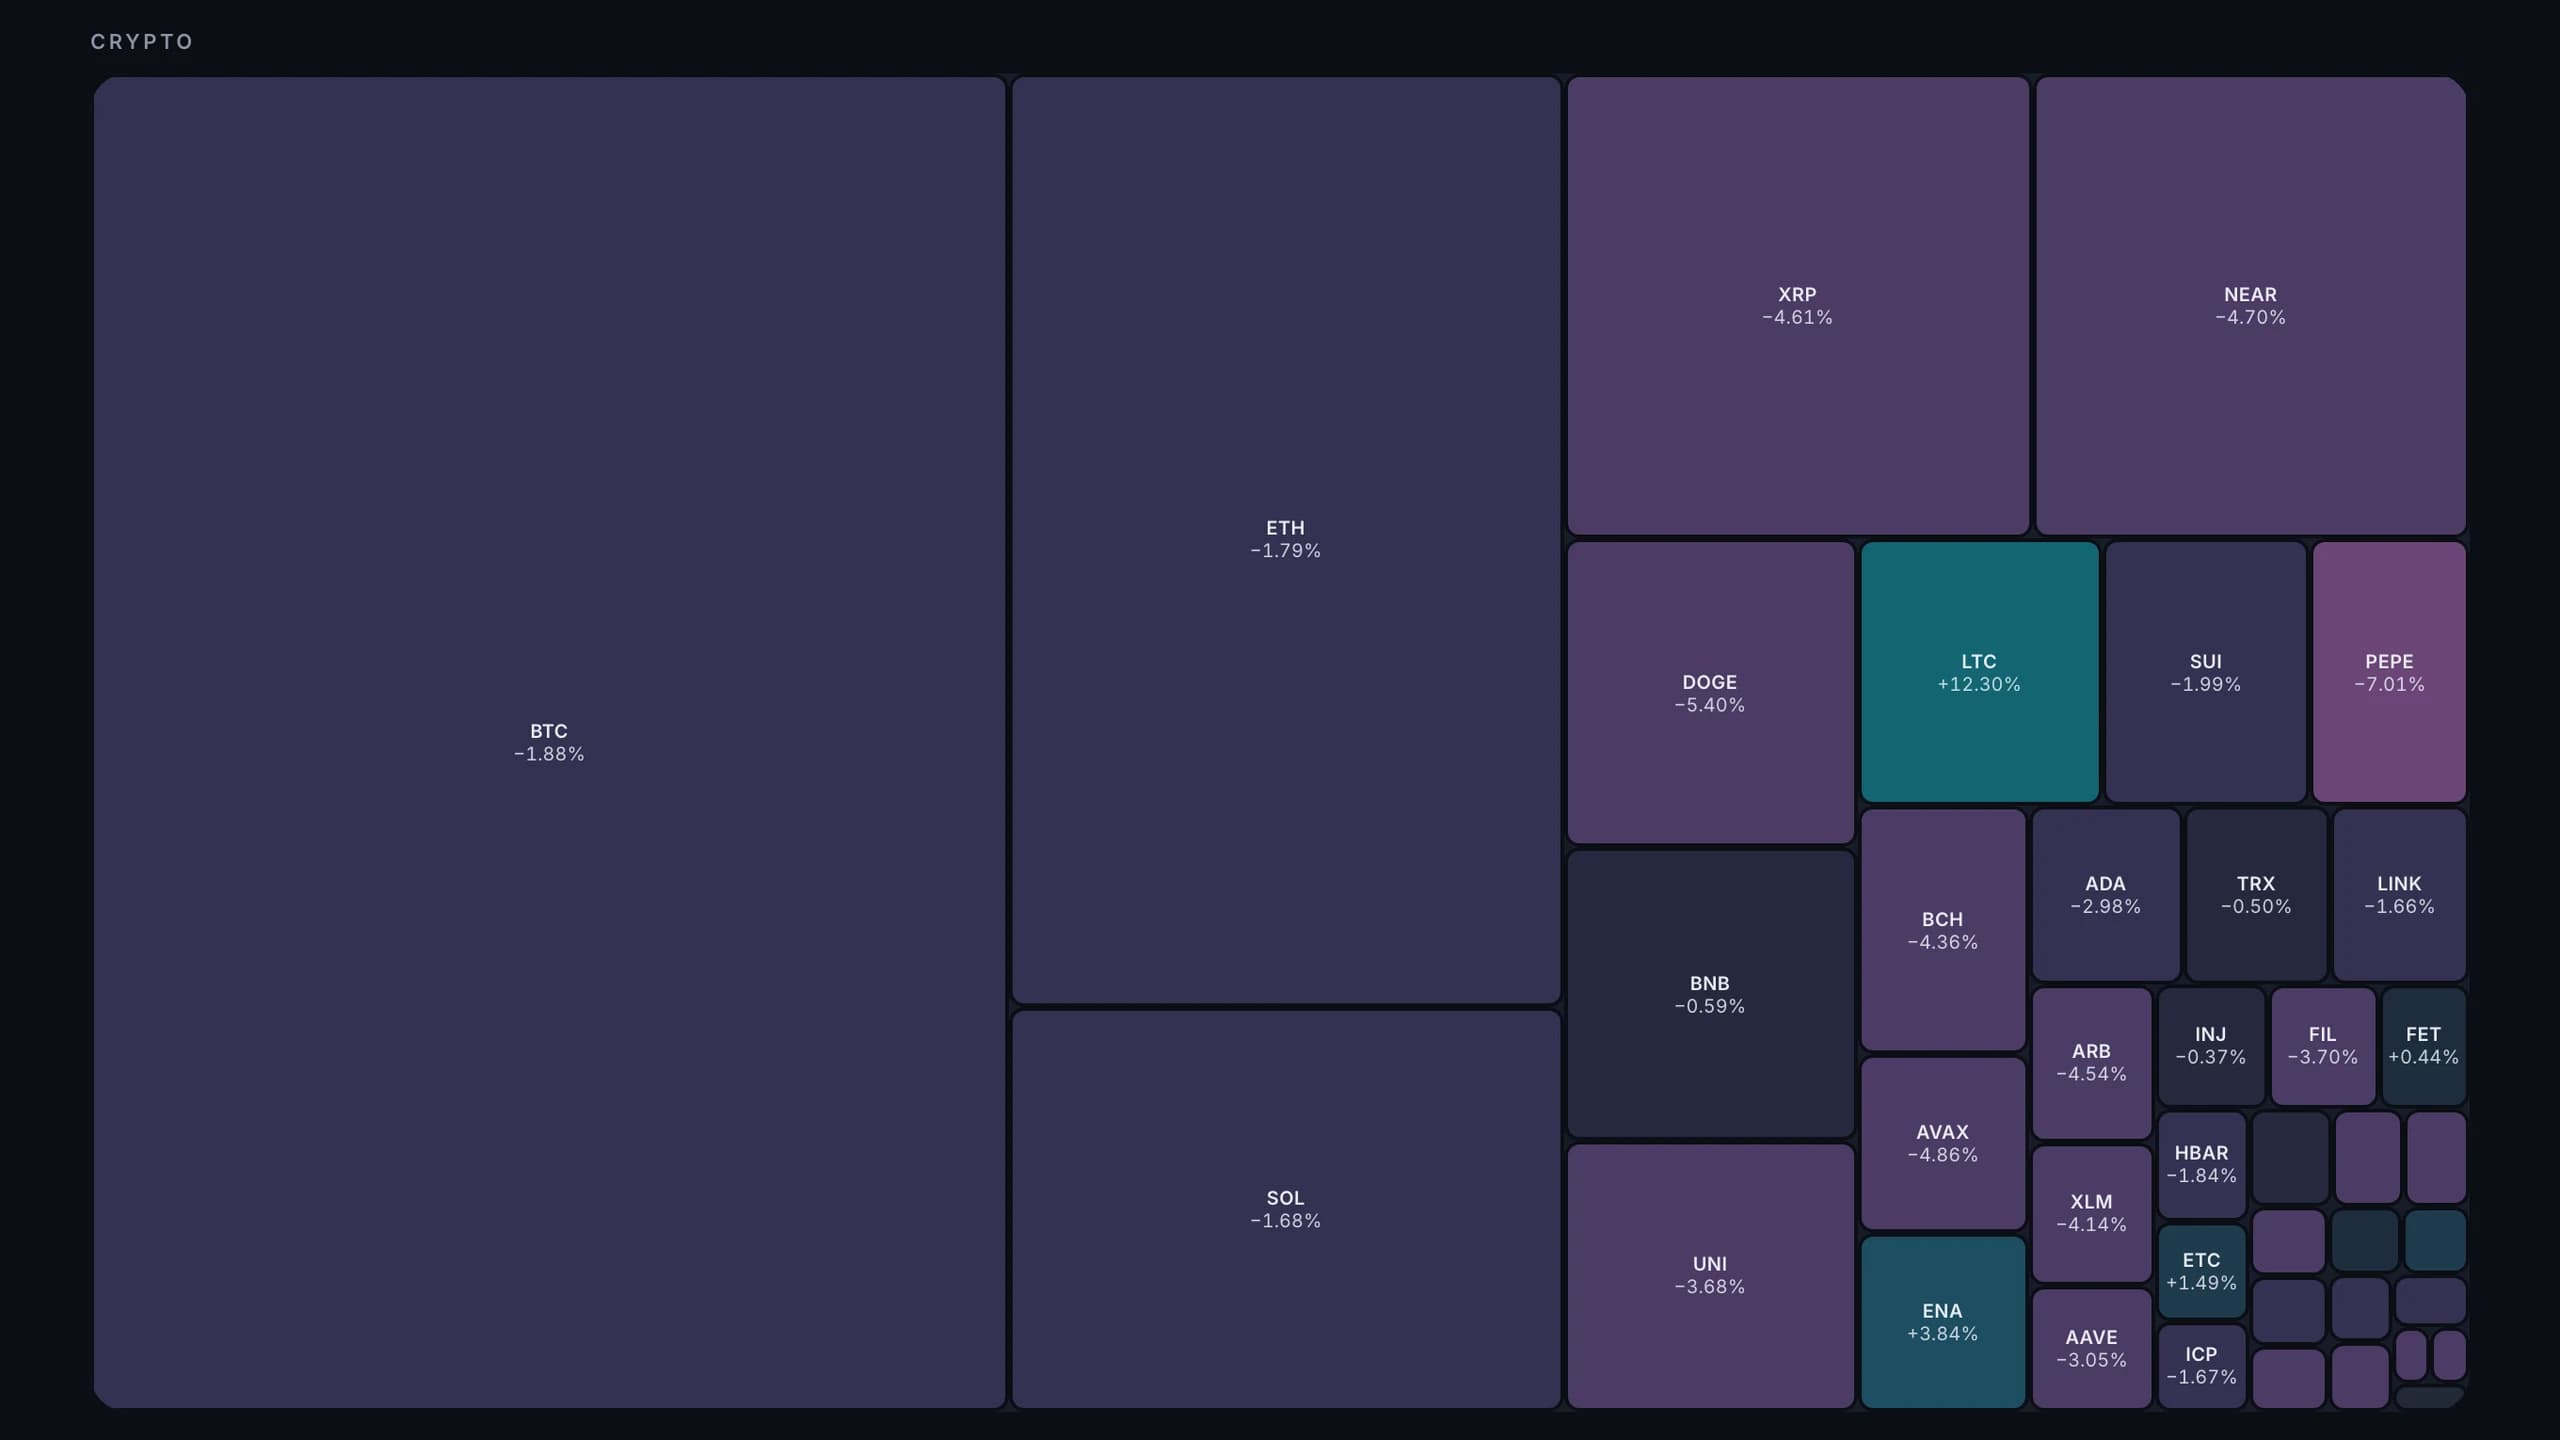
/heatmap/stocks groups US stocks and ETFs into eleven sectors plus ETFs. Each tile is sized by 24-hour turnover and coloured by the price move over a day or a week.
- Leveraged and inverse ETFs and contracts trading under $1M a day are left out, so the map shows what actually trades.
- Prices refresh every minute.
- Both heatmaps now have Crypto and US stocks tabs, and the embeddable widget can show stocks too.
Open any of these stocks on the chart from the Stocks tab of symbol search in the terminal.