Your trading journal now does the arithmetic
The trading section of your dashboard gains a stats summary and a daily P&L calendar, and the engine now records how far each position ran against you and for you before it closed.
A summary instead of a flat list
Until this release the trading page of the dashboard showed your last ten trades as a plain list, without so much as an R multiple. A record of what happened, but not an answer to the only question that matters: is this working?
Now the page opens with a summary. Net and gross P&L, what commissions took, how many trades, how many winners and losers — these are simply counted and always there. Win rate, expectancy, average win, average loss and average R need a sample, so they appear once the account has ten closed trades. Profit factor is left out entirely while you have had no losing trades, rather than printing an infinity that means nothing.
A calendar you can click
Under the summary sits a month of daily P&L, each day shaded by how good or bad it was. Click a day and it opens into the trades that made it — which is usually where the honest explanation of a bad week turns out to live: one Tuesday, three revenge trades.
How much you left on the table
The engine now follows an open position and remembers two points: the worst it went against you, and the best it reached in your favour. Traders know them as MAE and MFE, and between them they answer two questions a P&L column cannot:
- How close your stop really was — a winner that spent an hour a hair from your stop was luck, not a good entry.
- How much profit you gave back — the dashboard adds up, across winning trades only, the distance between the best point and what you actually took.
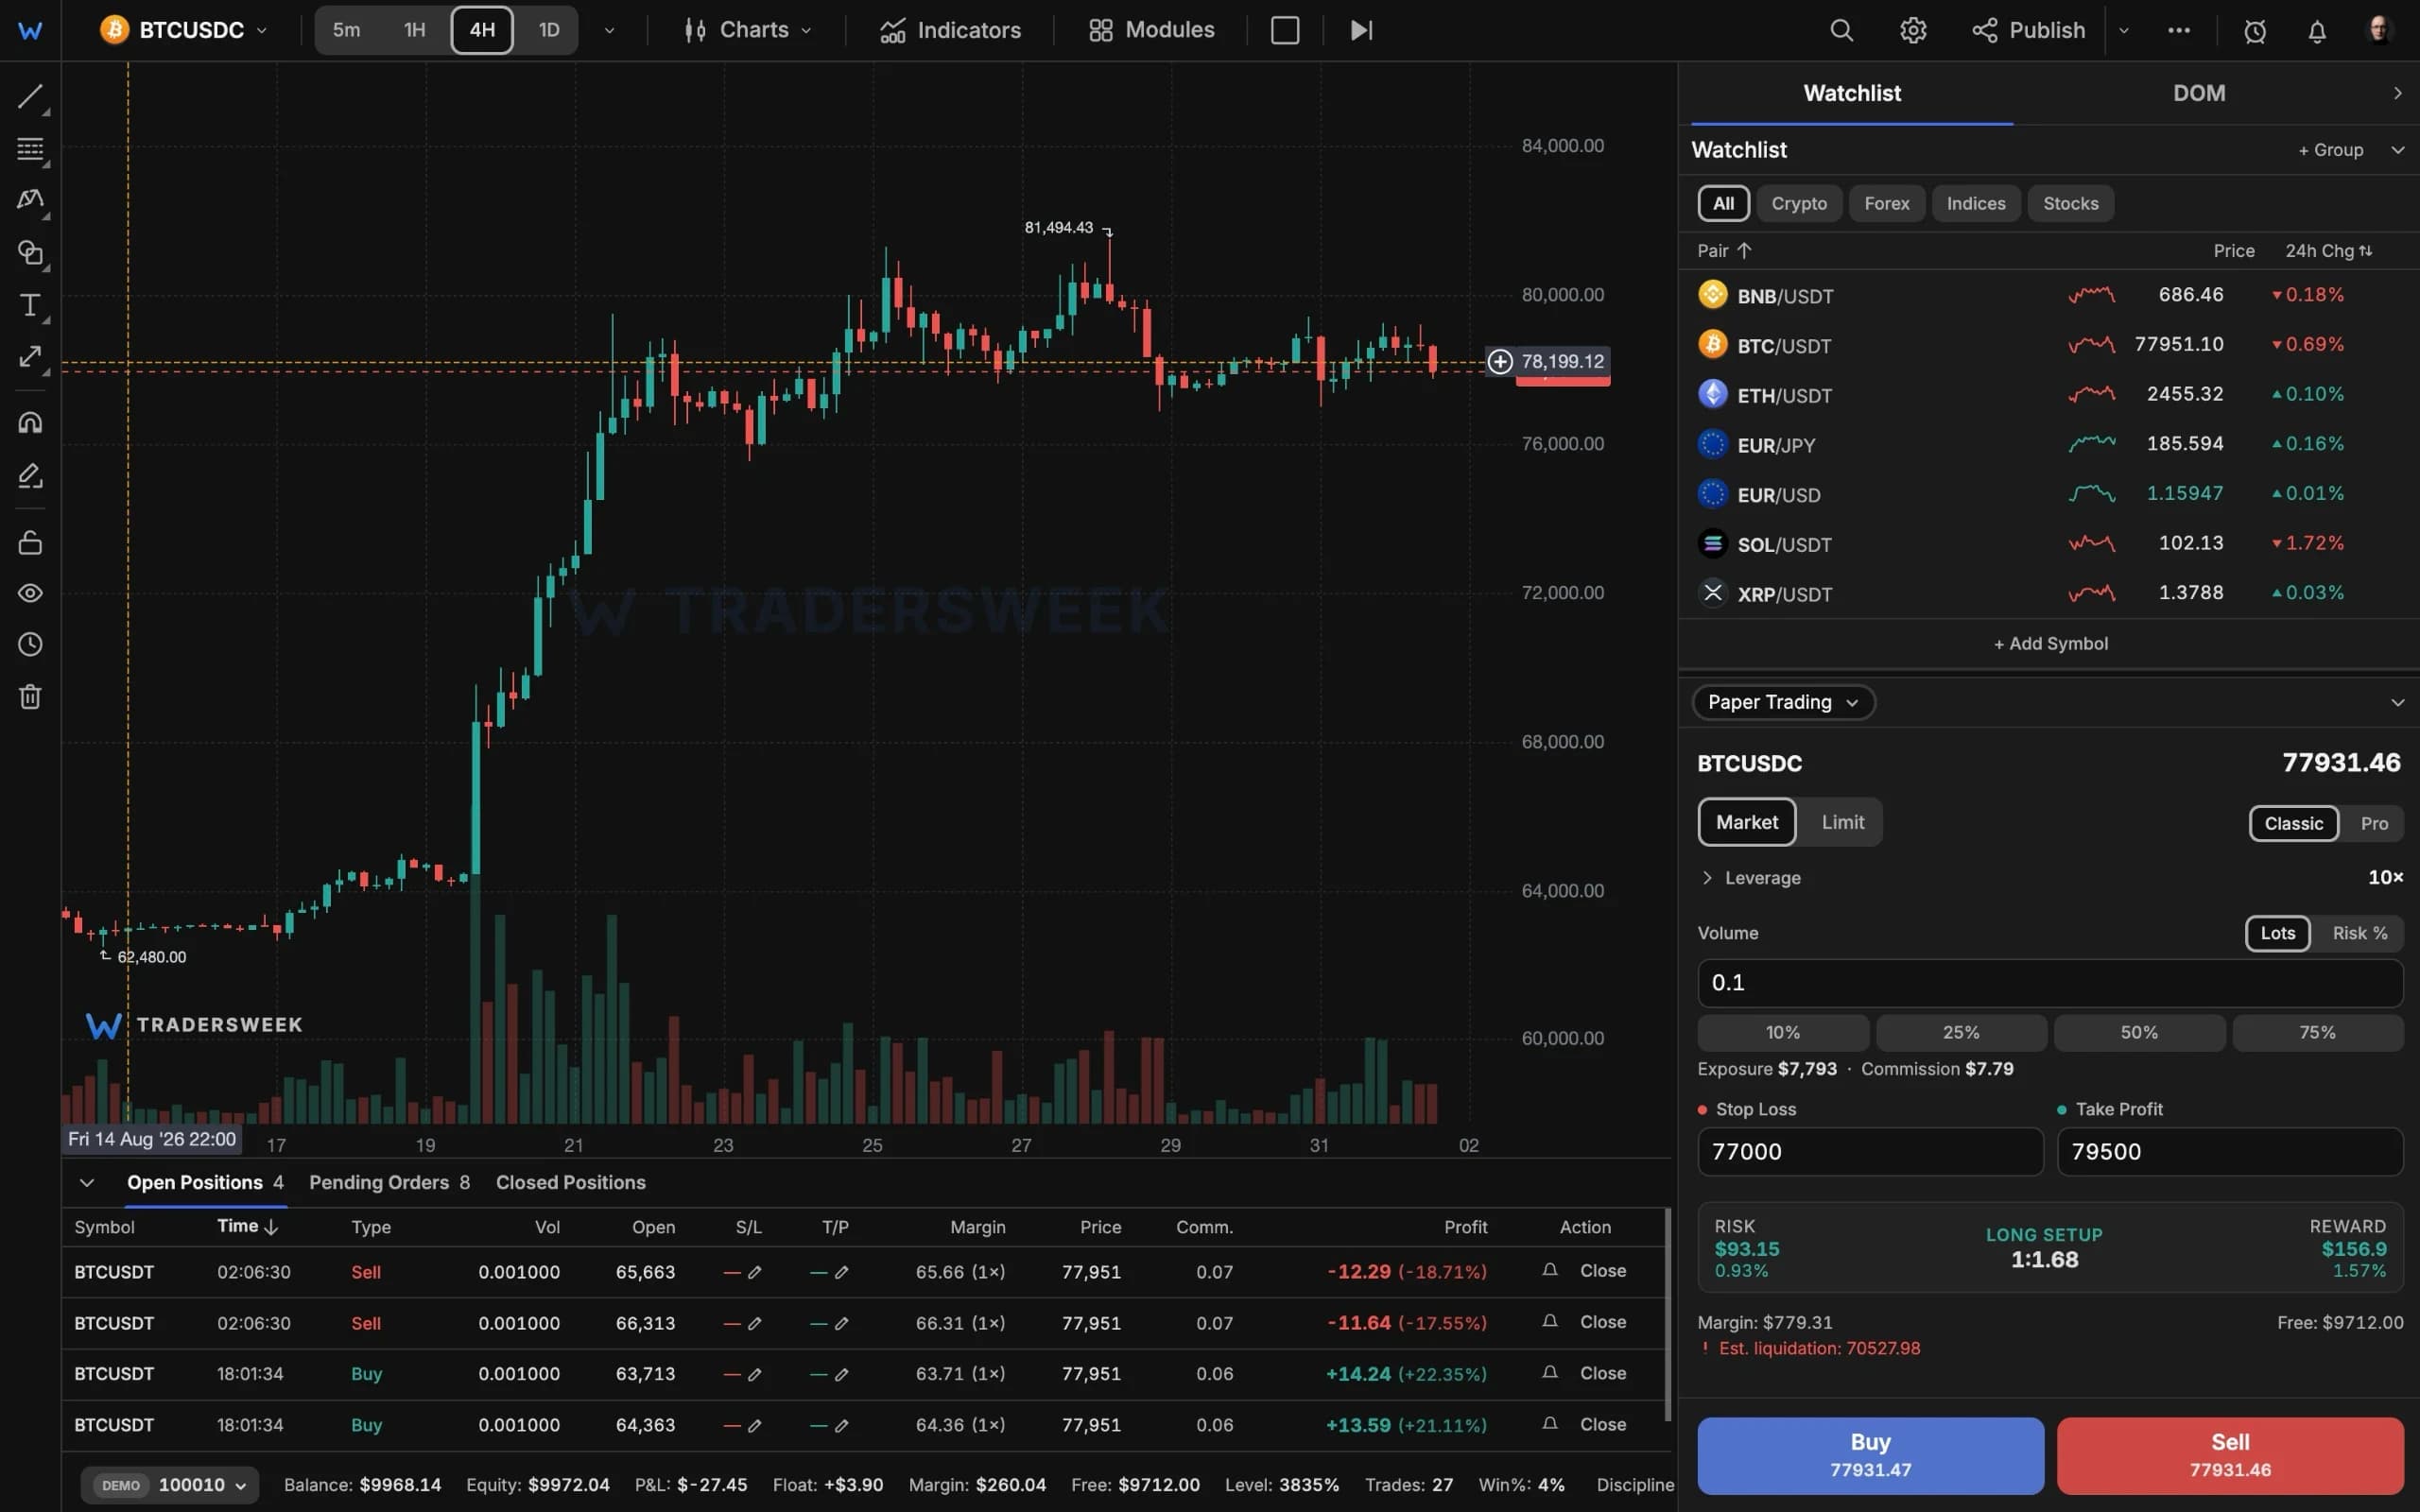
In the terminal the same two numbers arrive as columns in the trade journal, with a compact summary above the table.