2011issue C0837-42
A 5% trail cannot say whether the impulse-correction count is still alive
A fixed-percentage trailing stop, illustrated as 5% below entry, caps risk without saying whether a pullback is a reload inside the pattern or a failed thesis. The archive pairs Elliott wave labels with Fibonacci levels to time an entry, place an objective, and abandon a count. Editorial: enter only after a completed Fibonacci correction and a new-high confirmation, project the next impulse from the first, and treat a 61.8% break of the new leg as proof the label is wrong.
- A fixed-percentage trailing stop answers how much can be lost. It does not say whether a pullback is a reload inside the labeled pattern or a failed thesis.
- Treat a correction as a candidate only when it retraces 38.2% to 61.8% of the prior impulse. Then wait for a new high before the next upleg is confirmed.
- An equal-leg-objective projects the next impulse from the first. A 61.8% retrace of the working upleg is pattern-invalidation: the count is treated as wrong.
- In the Expedia walkthrough the second upleg reached the 28.50 objective and then reversed. The write-up treats that objective, not a later discretionary hold, as the reason to close.
A percentage stop cannot test the count
A fixed-percentage trailing stop, illustrated as 5% below entry, is described as capping risk. That figure answers how much can be lost. It does not explain whether a pullback is a reload inside the pattern or a failed thesis.
Editorial: TradersWeek reads that gap as the reason to write the wave count as a three-point hypothesis before entry. The count should say what must happen if the label is correct, where a gain is taken, and which print proves the label is wrong.
What the labeled pattern is allowed to do
Elliott wave analysis is presented as a way to specify what should and should not happen if the labeled pattern is correct, and therefore where to enter, take a gain, or abandon the trade. In that usage, elliott-wave is a chart-structure method that labels five-phase impulses and three-phase corrections so later price can confirm or falsify the count.
An impulse-wave is a sharp, directional five-phase trending leg used as the reference move for retracement tests and equal-leg targets. A correction is a slower, less directional three-phase or similar countertrend that often drifts more sideways than up or down. The correction should retrace a Fibonacci portion of the prior impulse without breaking the larger trend.
The Fibonacci window for a completed correction
Fibonacci retracement and extension levels are paired with the wave count to decide when a position is timely, where an objective sits, and when the assumed pattern is no longer valid. Fibonacci-retracement here means percentage pullbacks, especially 38.2% and 61.8%, used to judge whether a correction is complete and whether a new leg remains valid.
A correction is treated as a candidate only if it retraces 38.2% to 61.8% of the prior impulse. Less than 38.2% leaves the impulse unfinished. More than 61.8% is treated as evidence the traded trend may no longer be intact.
The Expedia walkthrough
In the Expedia example, a large July-August impulse lasting about five weeks was followed by a choppy correction of about 38.2%. A purposeful move through 25.00 was read as a new high that confirmed the next upleg.
The first upleg spanned about six points. From a second-leg start at 22.50 the case study placed a 28.50 objective on the observation that successive uplegs often match in size. That equal-leg-objective assumes the next impulse will travel a distance similar to the first, with 61.8%, 161.8%, and 261.8% noted as alternative Fibonacci relationships.
The initial stop was set at 23.50 because a break of that 61.8% retracement of the new upleg would mean either the advance had ended early or the wave labeling was wrong. That level is pattern-invalidation: a pre-specified print at which the wave hypothesis is treated as wrong. The stop could then be raised to the rolling 61.8% retracement as the upleg extended.
The case-study second upleg covered about seven points and reached the 28.50 objective before price reversed lower. The write-up treats that objective, not a later discretionary hold, as the reason to close.
What the case is allowed to teach
Editorial: the archive facts describe a historical workflow, not a rule that later markets must obey. The useful residue is the order of operations. Confirm the correction inside the Fibonacci window, wait for the new high, write the equal-leg-objective, and keep the 61.8% retrace of the working upleg as the kill-switch.
Expedia's second impulse reaches the 28.50 equality target
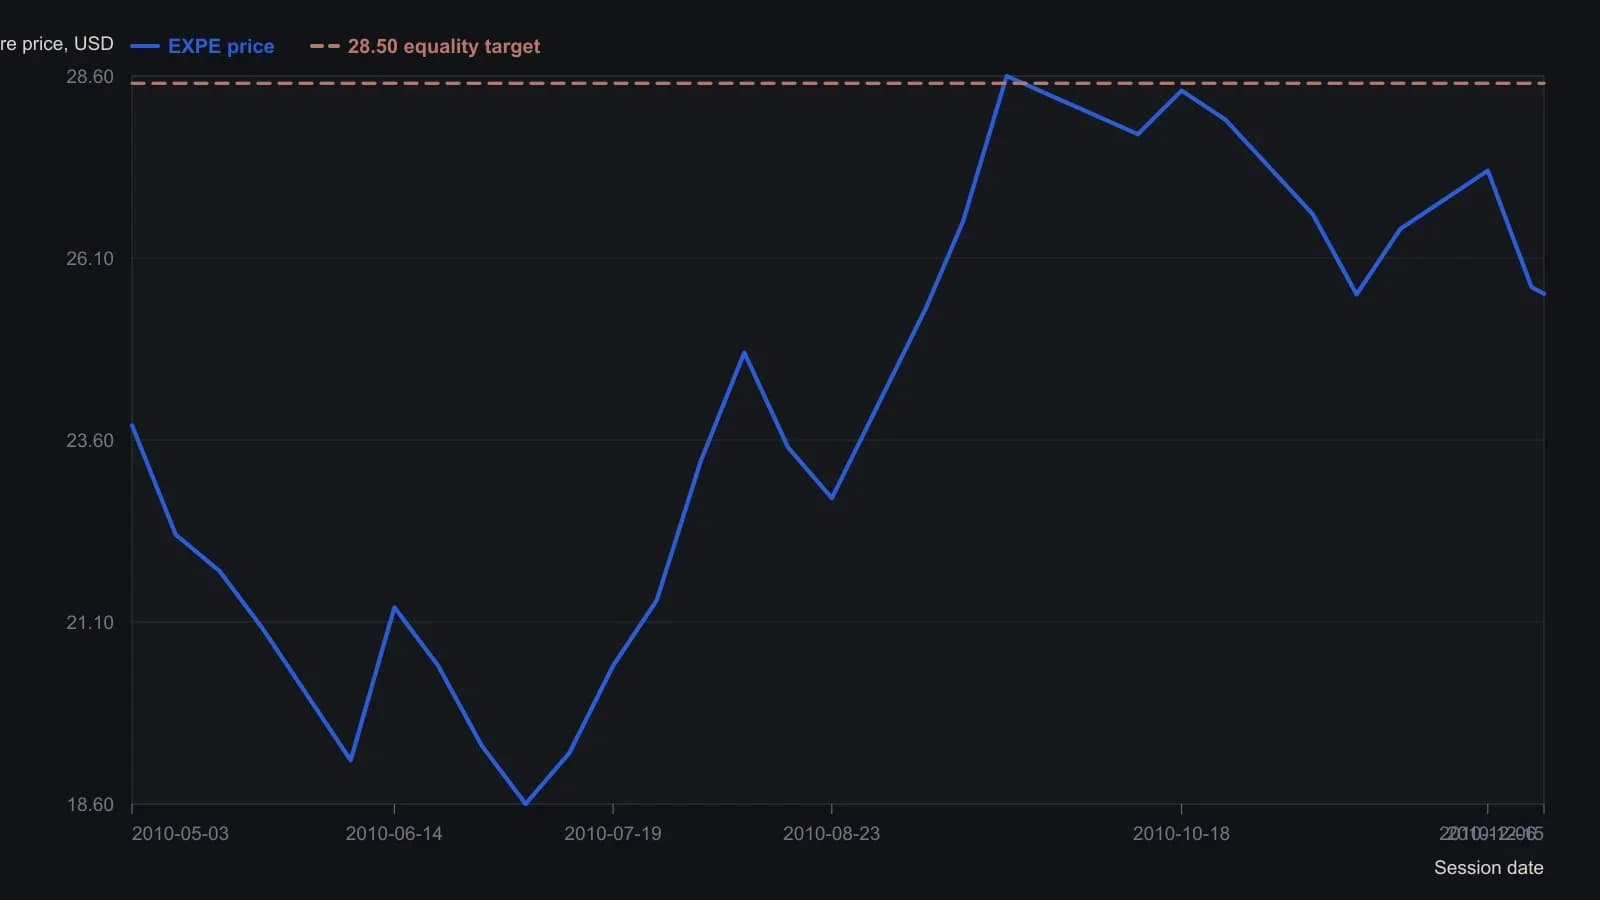
The first upleg is stated as about six points over five weeks and the follow-through as about seven. Digitized path prices are to the nearest tenth of a dollar except the printed 15 December close.
All readings on this track · 12 readings
- 2001Impulse-wave subcounts as a case-study filter
- 2006Wave 3 trend exits with pitchforks, channels, and Fibonacci
- 2006Four-leg Fibonacci reversal as an impulse wave checkpoint
- 2010An unfinished fifth wave blocked a second-wave count
- 2010Write the rubber-band long before the fill
- 2011A 5% trail cannot say whether the impulse-correction count is still alive
- 2012Wave counting as context before trade setups
- 2012A weekly-close test of impulse, correction, and the 61.8% stop
- 2013When wave templates fail under momentum override
- 2013Late momentum is a five-wave sentiment trap
- 2019Counting successive impulses after a productivity shock
- 2020Wave counts and Fibonacci targets as a falsifiable trade plan