2019issue C0944-46
Counting successive impulses after a productivity shock
After an economy-wide productivity shock, a new high is eligible to be labeled as the next elliott-wave impulse only if the rally itself has impulse-wave structure. A widening participation-base can put another successive-impulse-pattern on the table, and a falsifiable-count is discarded the moment that structure fails at the working chart scale.
- Treat wave-counting as a participation test: a new high may be labeled the next impulse only if the rally itself has impulse-wave structure.
- A widening participation-base, from more people joining a shared information and capital network, is why another successive-impulse-pattern can even be on the table after a shock.
- An elliott-wave reading is a falsifiable-count: if the expected impulse structure never appears at the chosen chart scale and horizon, the count is wrong.
- The archive expected later market behavior to reflect a global information shift, with public confidence, whether well founded or not, showing up in market decisions.
Wave-counting as a participation test
As a TradersWeek editorial interpretation, wave-counting after an economy-wide shock is a participation test rather than a forecast. A later rally is eligible to be labeled as the next elliott-wave impulse only if the advance itself has impulse-wave structure at the working chart scale.
An impulse-wave is a directional sequence that advances to a new high and can be treated as a completed market statement rather than a sideways pause. A successive-impulse-pattern is the repeatable chart condition in which one completed impulse is followed by another rally that also makes a new high.
The participation-base is the set of actors able to deploy capital and information into the same market after more people join a shared productivity network. Editorial interpretation: that widening base is why another impulse can even be on the table. The count is discarded the moment the expected structure fails at the working chart scale.
What the archive placed after the shock
The continuation argued that the process under discussion would again produce advances to new highs organized as successive impulse patterns.
A productivity table spanning 2007 through 2019 was used to show advanced-economy and Eurozone productivity weakening from 2007 into 2008 while the world average still rose. The 2010 figures in that table listed world-average productivity change at -0.1, advanced economies at -3.4, the Eurozone at -4.5, and developing countries at 2.9.
Broader productivity growth was attributed to more people entering a shared global productivity system through distributed information and communication technology. Financial capital was framed as unused capacity to deploy information, with actual capital deployment treated as the way productivity appears in markets.
Later market behavior was expected to reflect the arrival of that global information shift. Changes in economic conditions were said to alter public confidence, and that confidence, whether well founded or not, was expected to show up in market decisions.
Annual productivity change by region, 2007–2019
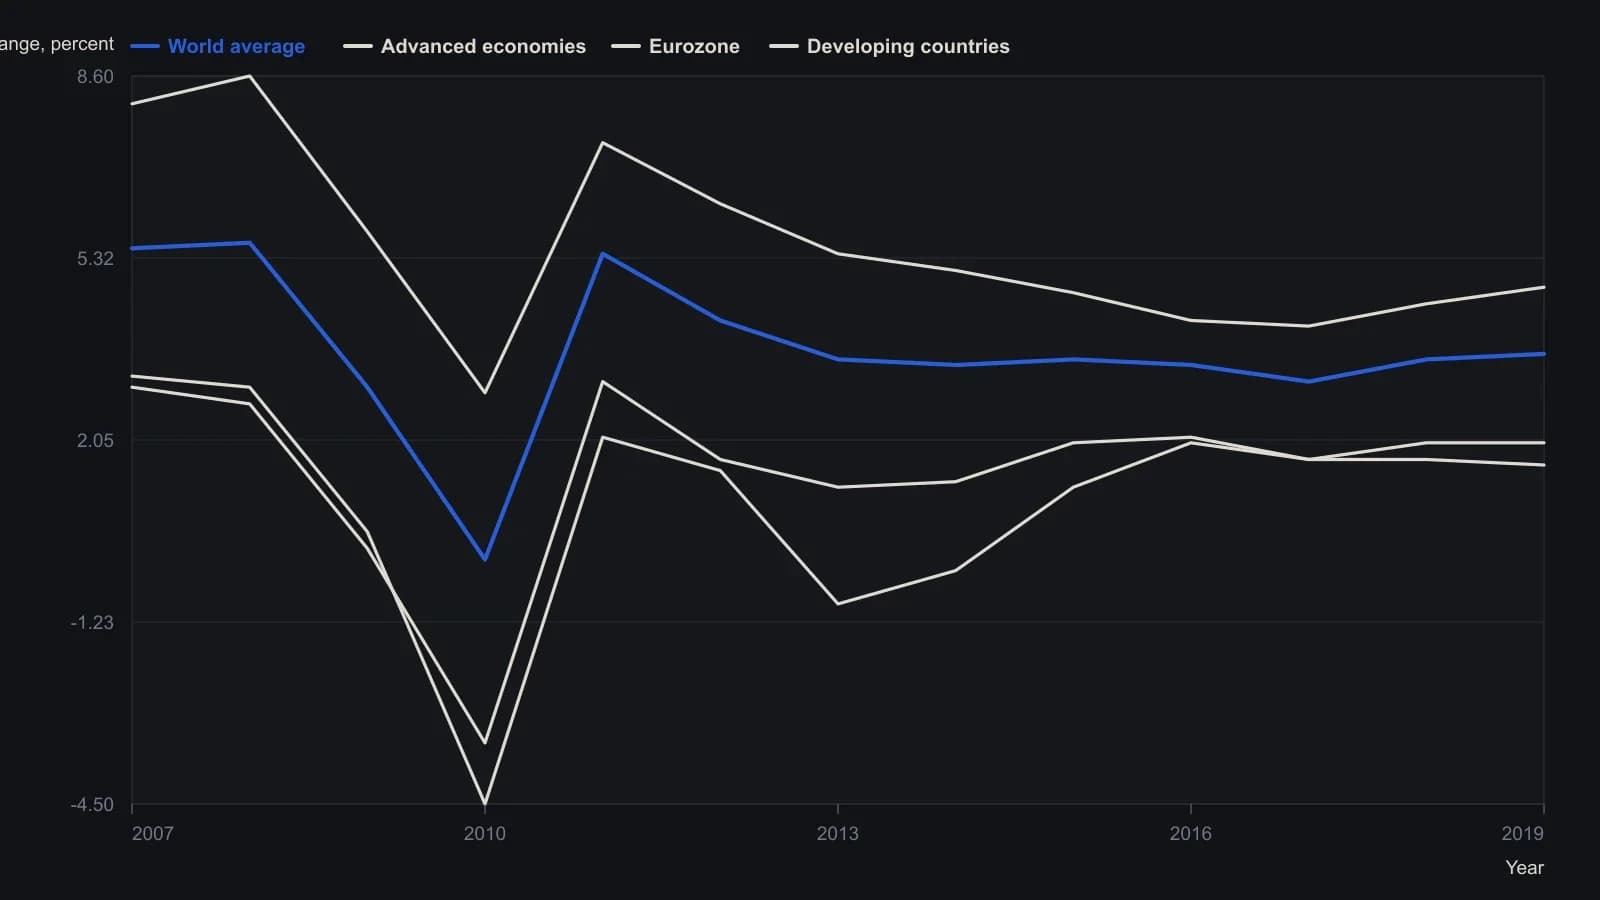
The figure heading is labeled through 2018, but the table also prints a 2019 column; those printed 2019 values are included.
Accepting or rejecting the next impulse
An elliott-wave reading alternates directional impulses with intervening corrections so a later rally can be accepted or rejected as the next impulse. Wave-counting labels successive swings on an OHLC chart so the next advance is a falsifiable-count: it either completes as another impulse-wave or the count is wrong.
As a TradersWeek editorial interpretation, the widening participation-base can justify putting another successive-impulse-pattern on the table after the shock. That only states that the next advance may be tested. If the rally does not complete as an impulse-wave at the chosen chart scale and horizon, the falsifiable-count fails and the labels are dropped.
All readings on this track · 12 readings
- 2001Impulse-wave subcounts as a case-study filter
- 2006Wave 3 trend exits with pitchforks, channels, and Fibonacci
- 2006Four-leg Fibonacci reversal as an impulse wave checkpoint
- 2010An unfinished fifth wave blocked a second-wave count
- 2010Write the rubber-band long before the fill
- 2011A 5% trail cannot say whether the impulse-correction count is still alive
- 2012Wave counting as context before trade setups
- 2012A weekly-close test of impulse, correction, and the 61.8% stop
- 2013When wave templates fail under momentum override
- 2013Late momentum is a five-wave sentiment trap
- 2019Counting successive impulses after a productivity shock
- 2020Wave counts and Fibonacci targets as a falsifiable trade plan