2020issue C1220-27
Wave counts and Fibonacci targets as a falsifiable trade plan
A daily chart from July 2015 through late July 2019 nests an impulse wave count and Fibonacci retracement targets around a July 2019 swing. Each new swing either confirms the current degree or forces a relabel, so the short, the exit, and the later long change with structure.
- From July 2015 the daily count starts with impulse [1], a full zigzag retrace as [2], nested (1)–(5) and 1–5 advances that complete [3], and a roughly 50% zigzag as [4].
- An abc pause after the first 1–5 rally above [3] is treated as evidence that [5] is extending, so that rally is relabeled (1) of a higher degree rather than a finished [5].
- After the 31 July 2019 long is closed, a short uses a 50% retrace of a roughly 1,000-point wave 1 clustered with a 161.8% downward projection, then exits automatically a little above the 261.8% projection after four sessions.
- Two follow-ups stay open: re-enter long under the 261.8% area, or stay flat until a C-2 low. A later hold of the lower volatility band and mid-line averages is the cue for a wave 3 long that remains provisional at 5/(5)/[5]/{5} extensions.
A multi-year impulse on the daily chart
A daily chart spanning July 2015 through late July 2019 is used to place a July 2019 swing inside a multi-year impulse wave that began after a long downward correction.
From July 2015 the Elliott wave analysis starts with impulse [1], a full retrace of [1] by zigzag [2], then nested (1)–(5) and 1–5 advances that complete [3] before a roughly 50% zigzag sets [4].
When the first 1–5 is not a finished fifth
An abc pause after the first 1–5 rally above [3] is treated as evidence that [5] is extending. That first 1–5 is therefore relabeled (1) of a higher degree rather than a finished [5].
The short after 31 July 2019
After the prior long is closed on 31 July 2019, a short is considered because the latest wave 1 advance is about 1,000 index points and wave 2 is expected to give back a large share of that rise.
A 50% Fibonacci retracement of that wave 1 sits near the 89-day average and the lower volatility band. A downward Fibonacci projection of the last zigzag (iv to 5-1) puts 161.8% near that 50% zone and 261.8% near the 233-day average.
The short is planned near the close or next open, with a stop just above the wave-1 high and an automatic exit a little above the 261.8% projection. That exit triggers after four sessions.
Why a single-wave correction is rejected
A large up candle then stalls at the 50% / 161.8% / lower-band cluster. Because wave 2 unfolded much faster than wave 1, a finished single-wave correction is treated as unlikely versus at least an ABC zigzag.
Two follow-ups and a provisional wave 3 long
Two follow-ups are defined: re-enter long immediately with a stop 50-100 points under the 261.8% area, or stay flat until a C-2 low and the start of wave 3 can be confirmed.
The subsequent bounce is labeled A then B, or a smaller a-b-c into c-B, after which C-2 is expected to undercut A. Price instead holds the lower volatility band and mid-line averages, which is used as the cue to open a long for wave 3.
The long is managed through 3-4 pullbacks to mid-line support, a pass of the 161.8% extension, and later a 423.6% reach that can mark valid 5/(5)/[5]/{5} tops. A still-lower-degree extension remains an open alternative, so the count stays provisional.
Nasdaq CFD daily crash and the wave 4 rebound
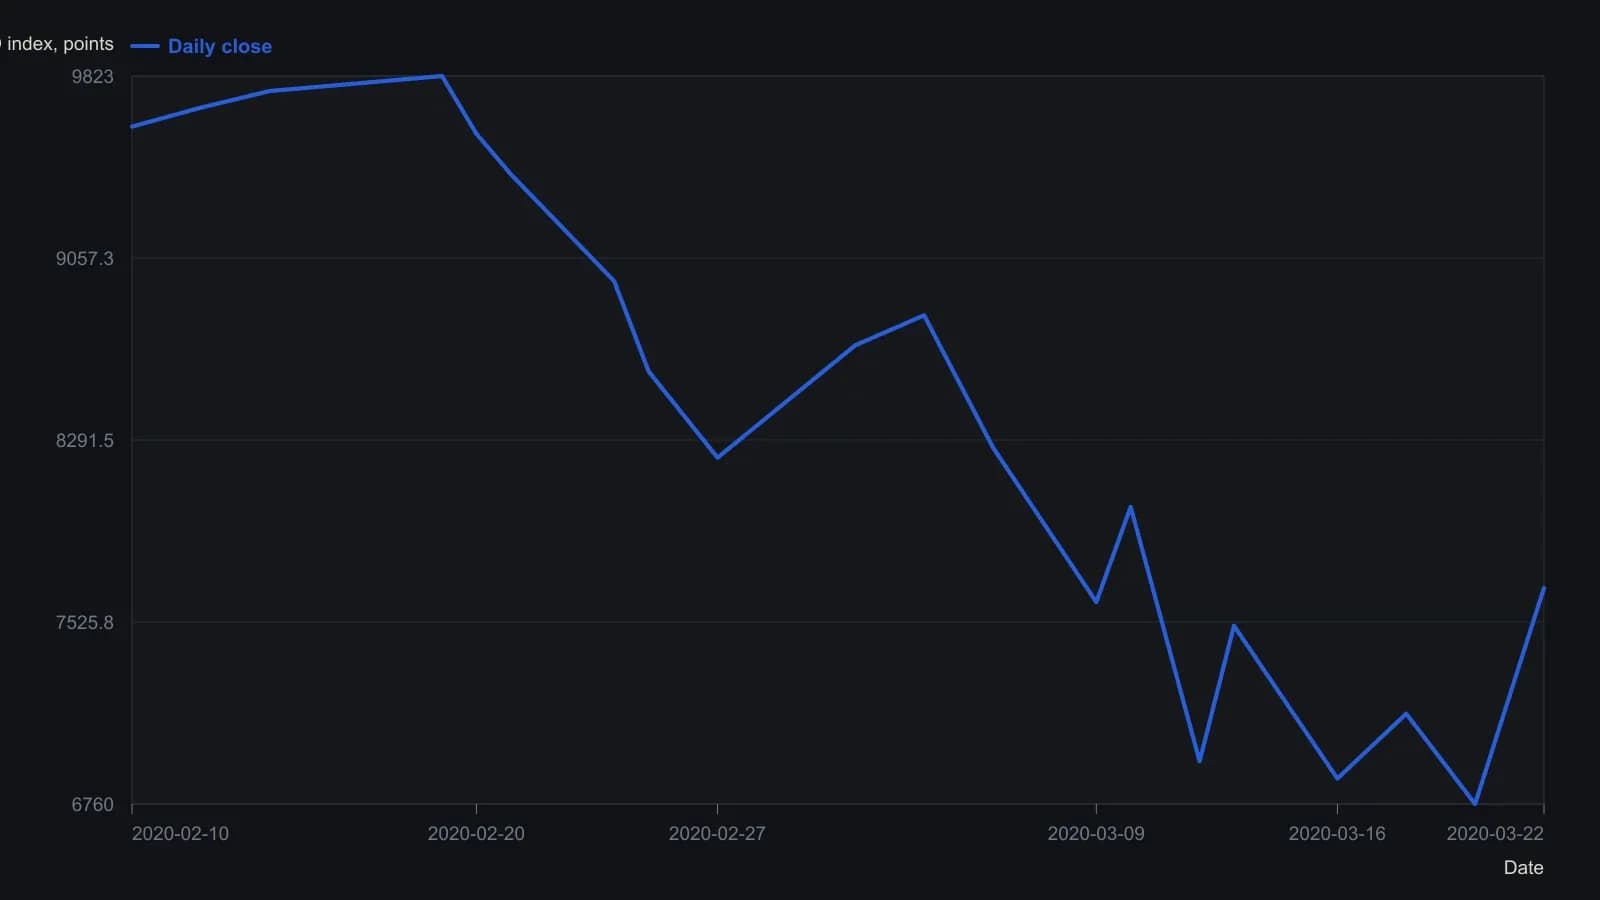
The screenshot is dark, so unmarked closes are rounded to about 10–50 points. Exact right-scale labels used as anchors: 9823.20 (high), 8815.50, 8216.80, 7668.70 (last print), 6867.00. Intra-candle wicks were not stored as extra closes.
All readings on this track · 12 readings
- 2001Impulse-wave subcounts as a case-study filter
- 2006Wave 3 trend exits with pitchforks, channels, and Fibonacci
- 2006Four-leg Fibonacci reversal as an impulse wave checkpoint
- 2010An unfinished fifth wave blocked a second-wave count
- 2010Write the rubber-band long before the fill
- 2011A 5% trail cannot say whether the impulse-correction count is still alive
- 2012Wave counting as context before trade setups
- 2012A weekly-close test of impulse, correction, and the 61.8% stop
- 2013When wave templates fail under momentum override
- 2013Late momentum is a five-wave sentiment trap
- 2019Counting successive impulses after a productivity shock
- 2020Wave counts and Fibonacci targets as a falsifiable trade plan