2017issue C1336-43
Top-down Elliott wave count alignment
A historical top-down Elliott workflow begins on the monthly chart with direction, wave labels, Fibonacci clusters, moving averages, and nearby end-run levels. The weekly chart times the entry and the daily chart only refines it, so the operational count stays aligned with the larger wave already in progress.
- Complete static top-down analysis on the monthly chart before any entry is considered.
- Repeat the same direction, wave, Fibonacci, moving-average, and end-run checklist on the weekly chart to time the trade.
- Use the daily chart to refine the count, add, or exit, not to invent a direction that fights the larger-degree wave.
- Keep operational-timeframe direction aligned with the upper-timeframe counts rather than trading against them.
Read the count from the top down
A top-down Elliott process starts on the monthly chart. Before any trade is planned, the checklist identifies dominant direction, the current wave labels, Fibonacci price and time clusters, simple moving averages, and nearby end-run levels.
That pre-trade pass is static top-down analysis. Top-down wave alignment then requires the same count to be read from the higher timeframe down, so the operational chart never trades against the dominant wave in progress.
The monthly crude-oil structure
In the historical crude-oil case, the larger monthly structure is described as a global impulse still inside the v-subwave of the (iii)-subwave of the C-subwave of wave W(4).
Dynamic top-down analysis updates the same checklist with where price came from, where it sits now, and which remaining wave would complete the larger structure. In this example the W(3) high is treated as being corrected by developing wave W(4).
Clusters that test the same count
Fibonacci price and time ratios are used to build clusters that can reverse, temporarily halt, continue a trend, or force a sideways pause.
End-run levels are nearby ahead-of-market and behind-the-market prices used to test whether a wave is likely to continue, stall, or reverse.
A triple pivotal cluster is several independent Fibonacci or swing projections landing on nearly the same price, treated as one stronger invalidation or continuation zone. On the daily chart, a triple pivotal cluster near the 4045 level is treated as a concentrated resistance zone built from nearby projections at 40.48, 40.47, and 40.41.
Crude-oil end-run ladder testing the W(4) count
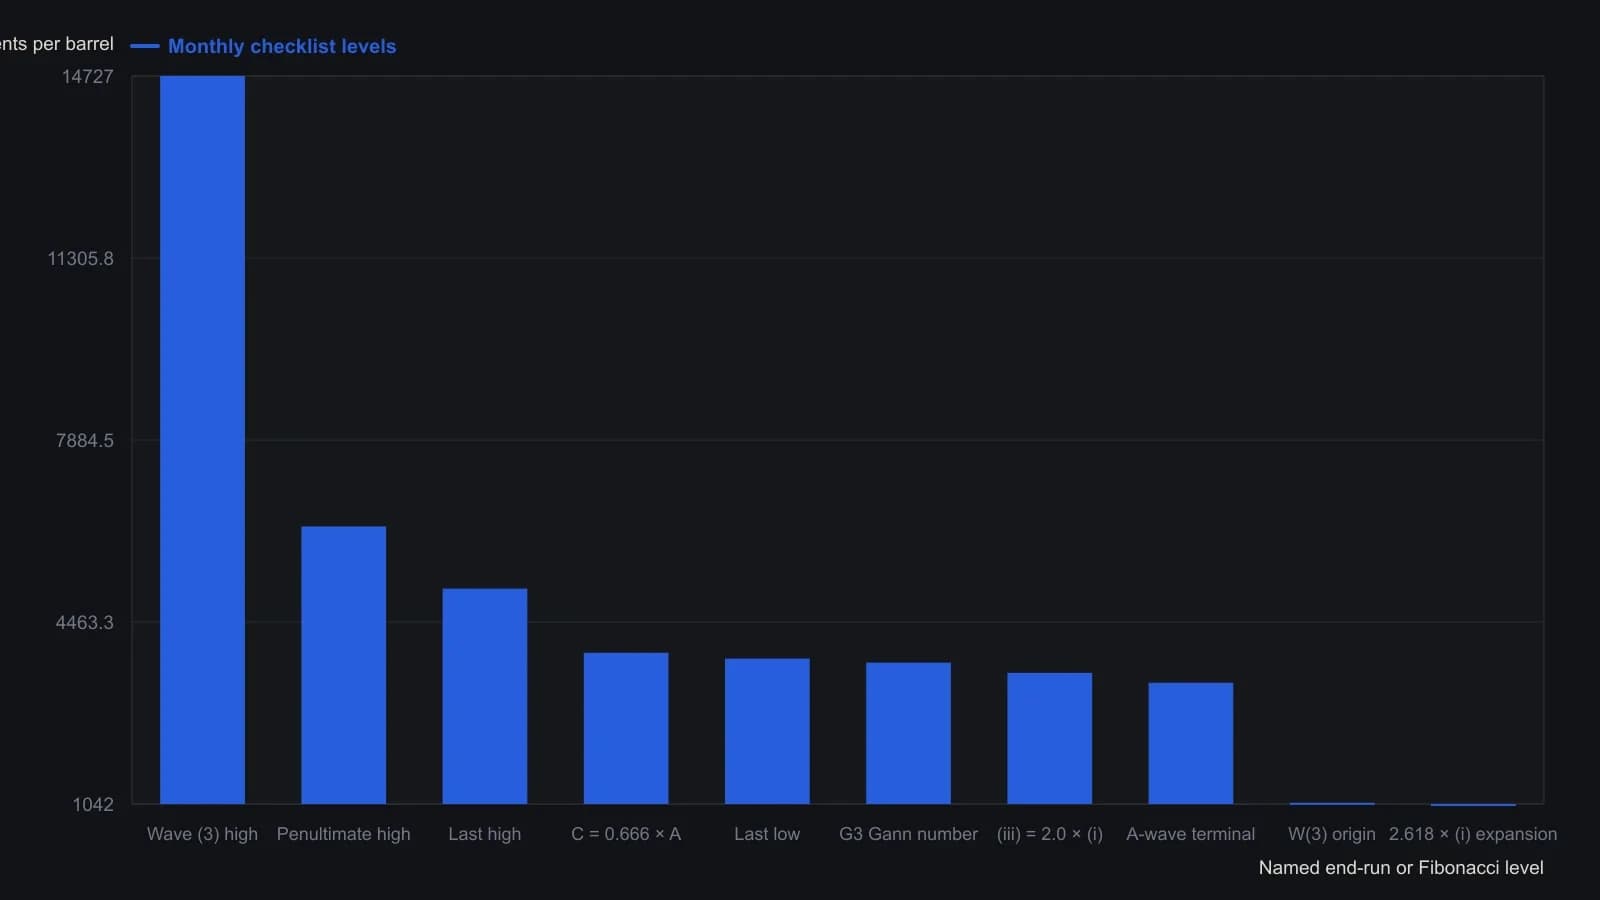
Quotes follow the article’s integer crude-oil futures scale, where one point is $0.01 a barrel. This is the named level set used to test the count, not a sampled candlestick path.
Weekly timing and daily refinement
The weekly chart is used to time the entry, estimate reward versus risk, and place the initial stop and trailing stops, while repeating the same direction, wave, Fibonacci, moving-average, and end-run checklist.
The daily chart is reserved for fine-tuning entries, adding to an existing position, and exiting, even when the actual entry decision is made on the weekly chart. On the daily chart the count is refined to a terminal three-swing correction, specifically the iii-subwave of v of v of (iii) of C of W(4).
Keep the operational count aligned
The historical case records two aligned executions of the same idea: a weekly entry at the 4248 level on November 20, 2015, and a daily execution at the 4745 level on November 4, 2015, a 497-tick gap.
The teaching close is that operational-timeframe direction should be aligned with the upper-timeframe counts rather than traded against them.
All readings on this track · 14 readings
- 1982Why wave counting stops full Elliott automation
- 1988Counting the 1987 Grand Supercycle peak as three claims
- 1990Promoting wave degree after a near-full retracement
- 1991A locked gold zigzag that had to produce two prices
- 2001Constructing Elliott wave counts with Fibonacci ratios
- 2002Constructing nested Elliott wave counts with ratio clusters
- 2002Auditing five-wave counts for overlap and length
- 2004A completed supercycle count as a Fibonacci ratio laboratory
- 2011The wave count as a falsifiable trade hypothesis
- 2014Constructing Elliott correction counts with Renko and zigzag
- 2015ABC wave labels as a square-of-nine timing hypothesis
- 2017Top-down Elliott wave count alignment
- 2019Wave-degree discipline for a 2018-2019 US long-wave top
- 2019Treat a completed cycle peak as a laboratory for repeating wave ratios