2014issue C018-9
Constructing Elliott correction counts with Renko and zigzag
An Elliott correction count is built on a three-step bench: compress small swings on a Renko chart, lock reversals only after a high-low zigzag mark, then nest ABC and 12345 labels so the next brick can still break the map.
- Filter smaller index moves with an adapted Renko chart first so fewer waves remain and an Elliott correction count is easier to label.
- Mark a new wave with a high-low zigzag only after the prior top or bottom, one candle later or after the previous brick extreme.
- Nest ABC, 12345, and XYZ labels on the filtered swings so later price can still break the count.
- Read the structure on fractal scale: one daily wave A can unpack into an abc zigzag or a 12345 impulse on a 15-minute chart.
Corrections stay harder to label than impulses
Elliott wave analysis is a nested labeling of directional five-leg impulses and three-leg or multi-leg corrections on a chosen chart scale. Impulse-wave labels are generally easier to assign than correction labels, which can stay long and internally complicated.
The main construction problem while waves are still forming is detecting a price reversal that starts a new wave. Elliott-wave counting is the act of assigning 12345, ABC, or XYZ labels to filtered swings so the structure can be checked against later price.
Compress overlapping swings first
Smaller index moves are filtered first with an adapted Renko chart so fewer waves remain and an Elliott correction count is easier to label. A Renko chart ignores moves smaller than a set tick or point size, which leaves fewer waves to mark.
On the same correction window shown on a 120-minute chart, a 500-tick five-point Renko chart is used.
S&P 500 500-tick Renko with high-low zigzag, May–June 2013 correction
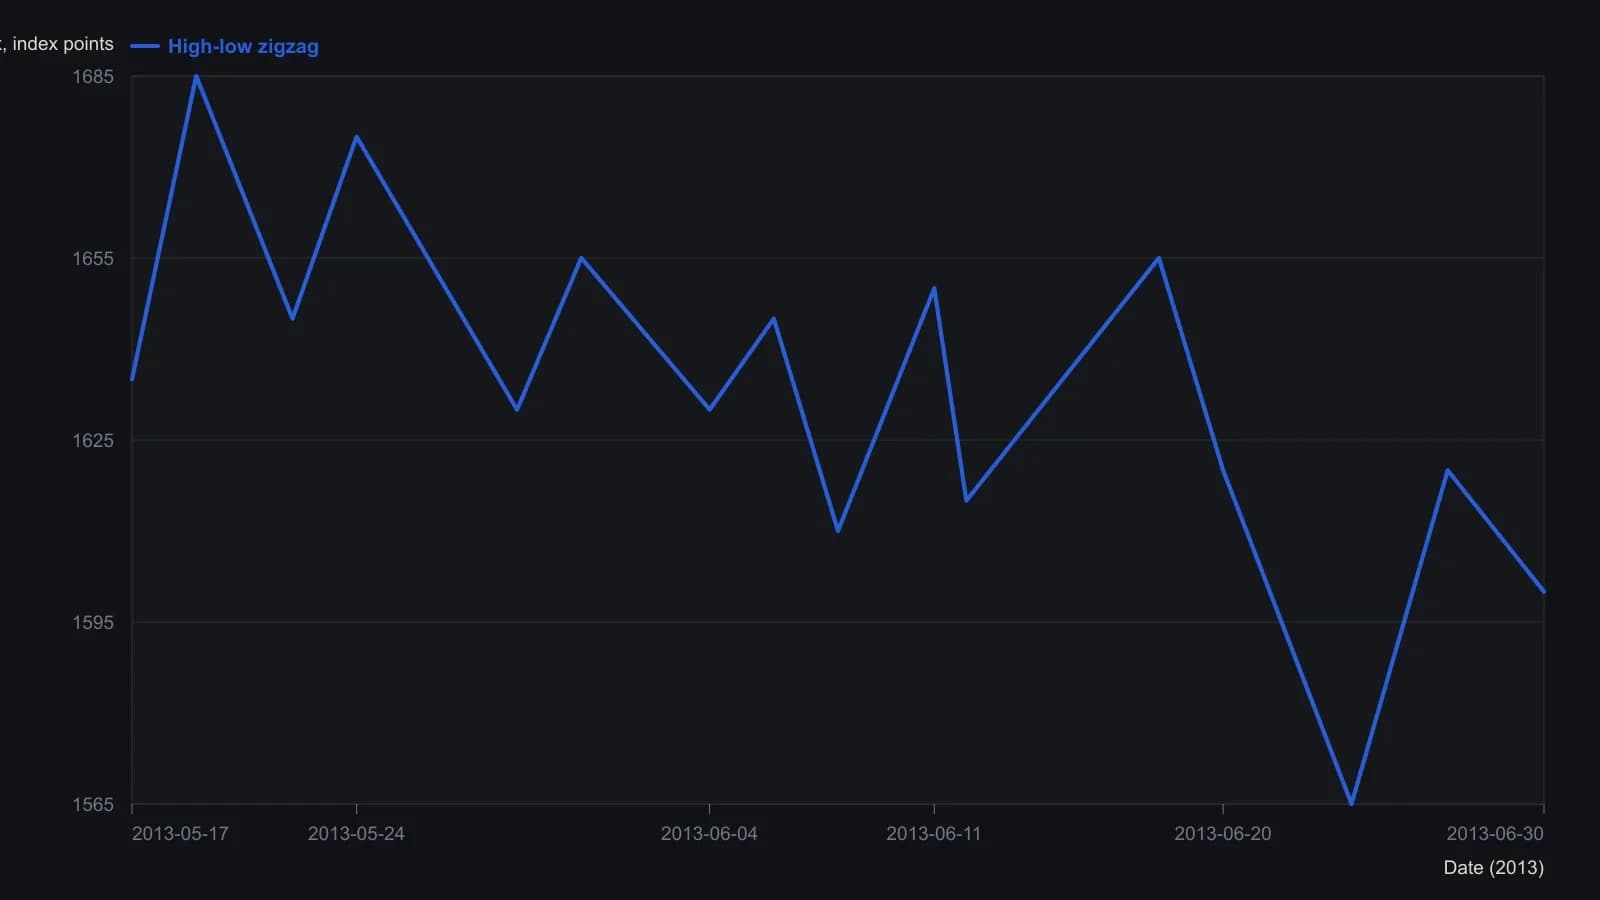
Source used an adapted 500-tick (five-point) Renko on S&P 500 with a high-low zigzag (parameter 2). Dates follow brick prints, so calendar spacing is uneven. Digitised from the raster; prices to the nearest 5 index points.
Lock only confirmed reversal marks
A high-low zigzag is used to mark that reversal, with the turn placed one candle after the prior wave top or bottom. The overlay flags the start of a new wave after a prior extreme prints.
On the Renko window, the zigzag reversal is taken after the previous brick's highest high or lowest low. Editorial: lock only that confirmed mark, not the still-printing extreme.
Nest ABC and 12345 legs as a checkable count
A zigzag correction is an ABC-style three-leg countertrend structure that may itself contain smaller abc or 12345 parts. An impulse leg is a five-move 12345 segment used inside a larger wave, including some C legs.
The count is constructed as fractal. One wave A on a daily chart can be labeled as an abc zigzag or a 12345 impulse on a 15-minute chart. Fractal scale means one labeled wave on a higher timeframe can unpack into a full smaller count when the chart interval is shortened.
A swing-count construction may treat wave 3 as 1.618 times wave 1, or start from a 100% retracement of wave 1 as the working first pullback.
An XYZ label is a finished map, not a close
One finished correction is labeled as an XYZ zigzag. X is an ABC with a smaller abc inside B and a 12345 impulse inside C, Y is an ABC advance, and Z is an ABC zigzag decline.
An XYZ correction is a completed three-segment correction in which X, Y, and Z are themselves ABC or mixed impulse-and-zigzag structures. That label is not treated as proof the larger correction is over.
All readings on this track · 14 readings
- 1982Why wave counting stops full Elliott automation
- 1988Counting the 1987 Grand Supercycle peak as three claims
- 1990Promoting wave degree after a near-full retracement
- 1991A locked gold zigzag that had to produce two prices
- 2001Constructing Elliott wave counts with Fibonacci ratios
- 2002Constructing nested Elliott wave counts with ratio clusters
- 2002Auditing five-wave counts for overlap and length
- 2004A completed supercycle count as a Fibonacci ratio laboratory
- 2011The wave count as a falsifiable trade hypothesis
- 2014Constructing Elliott correction counts with Renko and zigzag
- 2015ABC wave labels as a square-of-nine timing hypothesis
- 2017Top-down Elliott wave count alignment
- 2019Wave-degree discipline for a 2018-2019 US long-wave top
- 2019Treat a completed cycle peak as a laboratory for repeating wave ratios