1991issue C041-4
A locked gold zigzag that had to produce two prices
Two Elliott readings of the same gold market pointed opposite ways. As an editorial classroom exercise, this archive article keeps the unfinished-zigzag labels only when they produce two ratio-defined prices that later prints can confirm or retire.
- Two Elliott readings of the same gold market stood in opposition: a common count looking for a drop toward the $100-200 area, and an unfinished-zigzag count looking for a near-term rise into the $633.78-$662.29 zone.
- The unfinished-zigzag count treated the 1980-90 gold decline as unfinished supercycle wave II, locked cycle wave A at the $284 London print on February 25, 1985, and left cycle wave B still unfolding through a completed primary a, a double-three primary b, and a third-wave primary c.
- Two Fibonacci mappings turned that locked count into prices: $633.78 if cycle wave B retraced 0.618 of A, and $662.29 if a $317.04 rise equal to 1.618 times primary a's $195.95 length was applied.
- Editorial view: a wave label is allowed only when it produces two ratio-defined prices that later prints can confirm or retire.
Two readings of the same gold market
Two Elliott readings of the same gold market stood in opposition. The common count looked for a drop toward the $100-200 area. The unfinished-zigzag count looked for a near-term rise into the $633.78-$662.29 zone.
Elliott wave is a labeling system that treats market swings as impulsive or corrective structures nested by degree. Elliott wave counting is the act of assigning degree and letter or number labels so a price path can be confirmed or invalidated.
Editorial view: this article treats the unfinished-zigzag reading as a classroom object. Labels are allowed only when they produce two ratio-defined prices that later prints can confirm or retire.
How the unfinished zigzag was locked
A zigzag is a three-leg A-B-C correction in which A and C each subdivide into five waves and B subdivides into three. The unfinished-zigzag count treated the 1980-90 gold decline as supercycle wave II still unfinished. That unfinished supercycle, a degree larger than cycle and used here for the decline from the 1980 gold peak, opened with five down waves that completed cycle wave A.
Cycle wave A was labeled complete at the $284 London gold print on February 25, 1985. Cycle wave B was counted as still unfolding after a five-wave primary a that ended at $479.95 on May 20, 1987. Primary wave b was labeled a double-three, a sideways corrective construction made of two three-wave patterns, and was marked complete at $345.25 on June 14, 1990.
Primary wave c was treated as the third wave of cycle wave B and therefore the leg expected to do most of the remaining advance. In this count, cycle wave names the large A and B legs of the gold zigzag, and primary wave names the next-smaller a, b, and c legs inside cycle wave B. A third wave is the middle impulse in a five-wave sequence and is treated as the structurally strongest leg.
London gold, monthly, 1980–1989
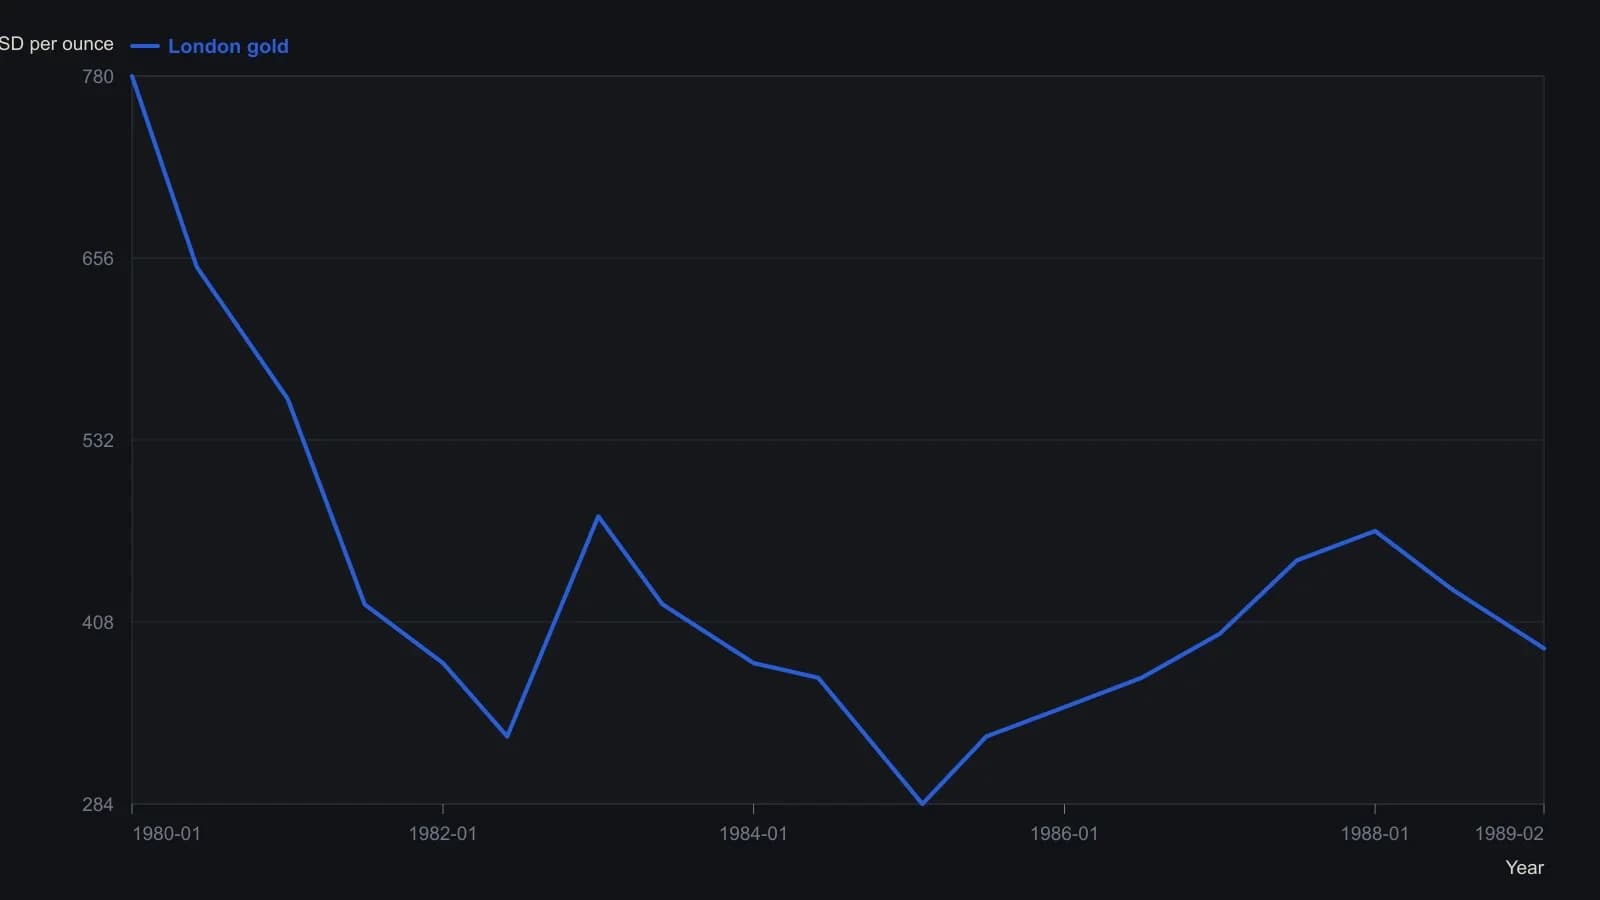
Raster is a yellow-background print scan, likely rotated in the source crop. Turning-point prices are approximate to about $10; the $284 print on 25 Feb 1985 is the article’s stated low, not a table extract.
Two ratio-defined prices from one count
Fibonacci retracement is a ratio overlay that measures a later swing against a prior swing to mark candidate turning prices. Fibonacci practice on a zigzag tests wave B as a 38%, 50%, or 61.8% retracement of A and wave C as equal to A or 161.8% of A.
One Fibonacci mapping placed a cycle-wave-B objective at $633.78, where B would retrace 0.618 of A. A second mapping used 1.618 times primary a's $195.95 length, a $317.04 rise, to project a $662.29 objective.
Those two prices are what made the unfinished-zigzag count testable against the opposing common count, which still looked for a drop toward the $100-200 area.
What later prints would test
The unfinished-zigzag count therefore asked later gold prints to test a near-term rise into the $633.78-$662.29 zone. The opposing common count asked those same prints to test a drop toward the $100-200 area.
Confirmation or retirement belongs to the later prints, not to the elegance of the labels. Editorial view: if later prints cannot meet, reject, or otherwise retire those two prices, the count has not yet earned its letters.
All readings on this track · 14 readings
- 1982Why wave counting stops full Elliott automation
- 1988Counting the 1987 Grand Supercycle peak as three claims
- 1990Promoting wave degree after a near-full retracement
- 1991A locked gold zigzag that had to produce two prices
- 2001Constructing Elliott wave counts with Fibonacci ratios
- 2002Constructing nested Elliott wave counts with ratio clusters
- 2002Auditing five-wave counts for overlap and length
- 2004A completed supercycle count as a Fibonacci ratio laboratory
- 2011The wave count as a falsifiable trade hypothesis
- 2014Constructing Elliott correction counts with Renko and zigzag
- 2015ABC wave labels as a square-of-nine timing hypothesis
- 2017Top-down Elliott wave count alignment
- 2019Wave-degree discipline for a 2018-2019 US long-wave top
- 2019Treat a completed cycle peak as a laboratory for repeating wave ratios