2002issue C121-3
Spike-shaped double bottoms as a three-gate chart drill
Treat spike-shaped twin lows as three separate chart conditions: a shared-level sketch with a wide bounce, a close through the interior high, and a later rounded throwback to that same high.
- After a decline, two lows become a twin-bottom sketch when they sit at nearly the same price, are several weeks apart, and bounce at least 10% between them.
- The sketch stays unconfirmed until a close above the highest high between the bottoms. That interior high is the breakout price.
- In the historical sample, skipping that confirmation close was followed by a move below the lower bottom in 64% of cases.
- A throwback is a rounded return to, or approach of, the breakout price within 30 days, leaving open space rather than sliding sideways along that level.
Three gates, not one finished picture
A familiar double-bottom outline can look complete as soon as two spike lows appear. Editorial reading: keep the outline as a sequence of conditions, and mark each one true or false on the chart before moving on.
The first gate asks whether the two lows truly share a level and whether the bounce between them is wide enough. The second gate treats a close through the interior high as the only event that turns the sketch into a breakout. The third gate treats a rounded return to that same high as a later, expected test.
First gate: shared lows and a wide bounce
After a decline, the twin-bottom sketch is identified when two lows sit at nearly the same price, are several weeks apart, and the bounce between them is at least 10%. The two lows may differ by as much as 4% and still fit the identification rule. One illustrated pair differed by 63 cents, or 2.5%.
Adam-type lows are long and narrow, often a one-session downward spike. Eve-type lows are shorter, wider, and more rounded. Editorial reading: the Adam spike is the visual case this drill starts from. The Eve shape is the rounded contrast that shows why those lows are long and narrow.
FAST Adam spikes, then 65% run after Shark-32
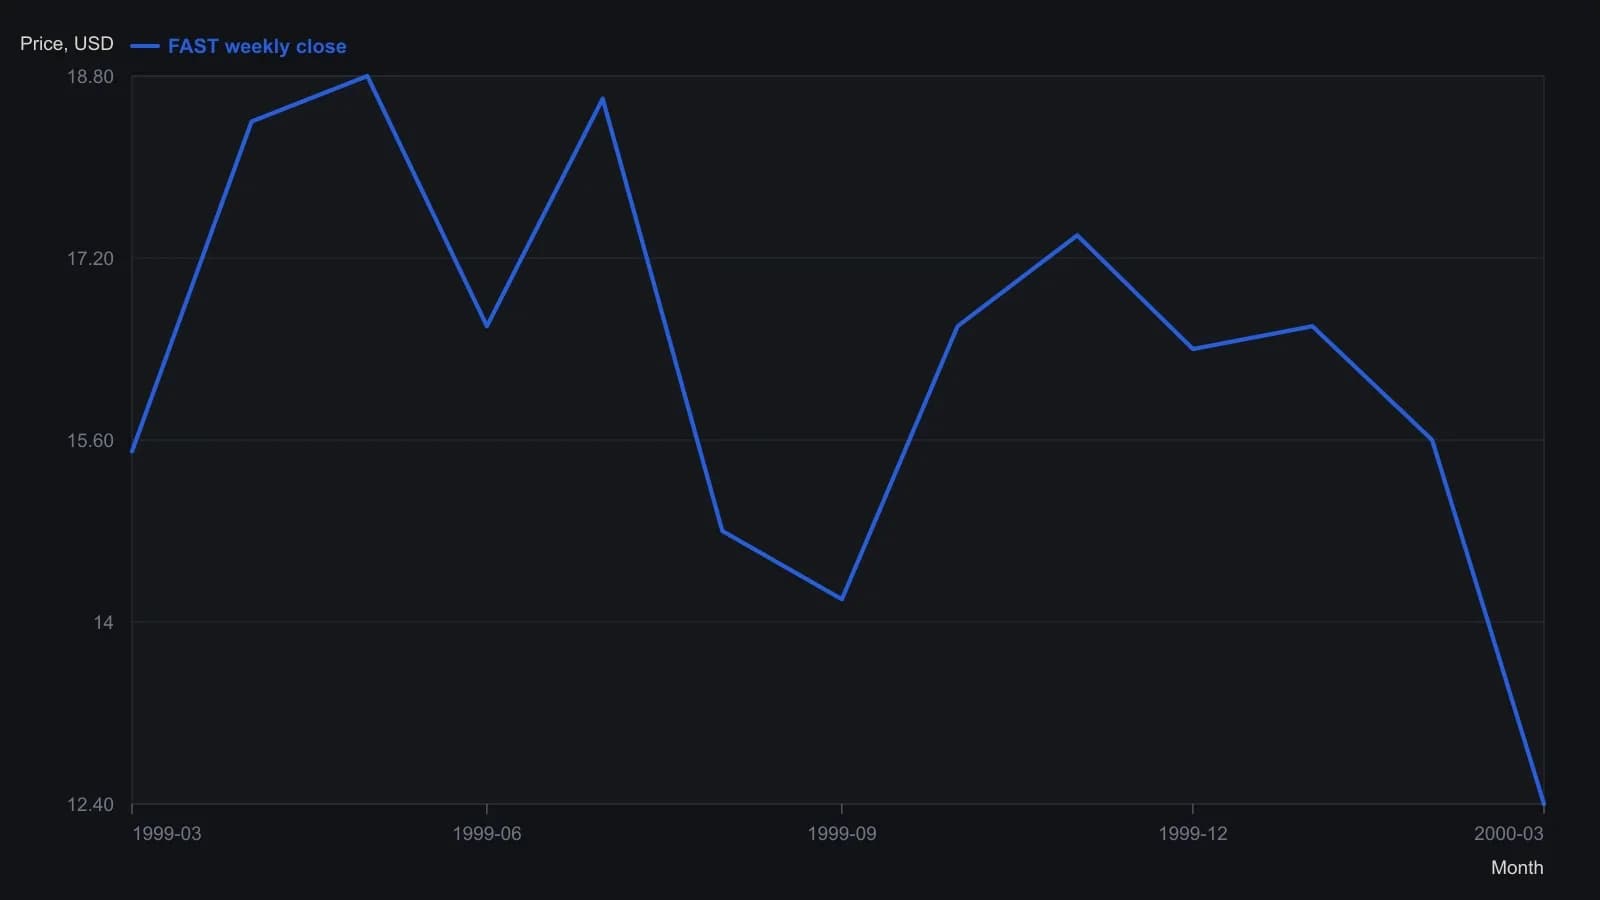
Weekly OHLC approximated from the Figure 2 raster; y-values are closes to the nearest 0.1 and are not tick-exact. Shark-32 sits in late April per the article.
Second gate: a close through the interior high
The twin-low sketch is unconfirmed until price closes above the highest high between the bottoms. That interior high is the confirmation, or breakout, price.
When the twin lows sit inside a broadening range, the double-bottom breakout remains the highest high between the two bottoms. That interior high can be easier to mark than the broadening structure's own breakout.
In the historical sample, skipping the confirmation close was followed by a move below the lower bottom in 64% of cases.
Third gate: a rounded return to the same high
A throwback is a return to, or approach of, the breakout price within 30 days, with a rounded arc and open space rather than a sideways slide along the breakout. In the historical sample, a throwback followed the confirmed pattern about 65% of the time. A nearby horizontal congestion block was used as a cue that such a return was more likely.
That congestion block is overhead resistance: a horizontal band above the breakout that can cap the advance and foreshadow a throwback. Editorial reading: a rounded return to the confirmation price is a separate test of the same level, not proof that the reversal failed.
Mark each condition separately
Editorial reading: the lesson of the drill is the sequence. Shared lows and a 10% bounce identify a sketch. A close above the interior high confirms the breakout. A later rounded throwback tests that same high. Each statement can be true or false on the chart without forcing the others to follow.
All readings on this track · 10 readings
- 1991GM support and resistance role reversal
- 2002Evaluating throwbacks and pullbacks after triangle breakouts
- 2002Spike-shaped double bottoms as a three-gate chart drill
- 2003Constructing bullish bottom patterns from structure and confirmation
- 2003Classifying breakout gaps by fill speed and throwback
- 2006The J-hook as two gates: rounded pullback and prior-high breakout
- 2006Evaluating double tops with a throwback clock
- 2007Check duration, breakout labels, and throwback timing before rectangle measuring rules
- 2016Confirmed double-bottom, later pennant, and throwback as separate checkpoints
- 2020Late double-bottom entries after throwbacks