2006issue C041-3
The J-hook as two gates: rounded pullback and prior-high breakout
A J-hook is a 1-2-3 continuation shape: a sharp advance, a profit-taking decline that rounds at the lows, then a turn back up that looks like a hook. Candlesticks time when the first advance is treated as complete, the rounded pullback stays a hypothesis until selling fades, and the prior-high test decides whether that peak is resistance or a new trend leg.
- Read candlestick formations with the J-hook as a graphic record of fear and greed, not as a standalone signal.
- A sell signal at the end of the first sharp advance is a reason to step aside, because pullback depth is not fixed and the hook may never form.
- After selling fades, a second long hypothesis uses the recent high as the first test. A sell into that high is resistance. Strong signals through it are a prior-high breakout.
- The first screen is a relative-strength alert: a name that rose faster than the market and is easing while the indexes do not yet look ready for a major decline.
A 1-2-3 continuation shape
The J-hook is defined as a 1-2-3 wave variation: a sharp advance, a profit-taking pullback that rounds at the lows, then a turn back up that forms the hook.
Candlestick formations are treated as a graphic record of fear and greed. They are meant to be read together with this shape rather than in isolation.
The first screen is relative strength
The first screen for a possible J-hook is a relative-strength alert: a name that has risen more sharply than the market, then pulls back while the broader indexes do not yet look ready for a major decline.
Candlesticks mark when the first advance is complete
Candlestick sell signals at the end of the first advance, often aligned with an oscillator in overbought territory, mark when that initial uptrend is treated as complete.
Pullback depth is not fixed. A decline can retrace 20 percent, 40 percent, 60 percent, or more, so the first sell signal is used to step aside rather than assume the hook will form.
The rounded pullback stays a hypothesis
The declining middle segment after the first vertical leg is the rounded pullback. After a few days of decline, doji, hammers, inverted hammers, and bullish harami are listed as signs that selling is starting to fade. Those candlestick reversal signals mark when buying or selling pressure is fading at the bottom of the hook.
If small bullish candlestick signals appear after about four days of pullback, a second long hypothesis can be framed with the recent high as the first test level.
Buy signals after a short pullback are used to choose between treating the move as a full reversal and treating it as a continuation hook that can reestablish longs.
The prior-high test accepts or rejects the bounce
The first measured level after a rounded low is the peak of the initial advance. That prior-high test separates a failed bounce from a completed hook.
A sell signal as price approaches the recent high is read as that high acting as resistance. Strong signals as the high is breached are read as the high failing to cap price and a new trend leg beginning. That acceptance is the prior-high breakout.
DJIA daily, July–December 2005: year-end J-hook
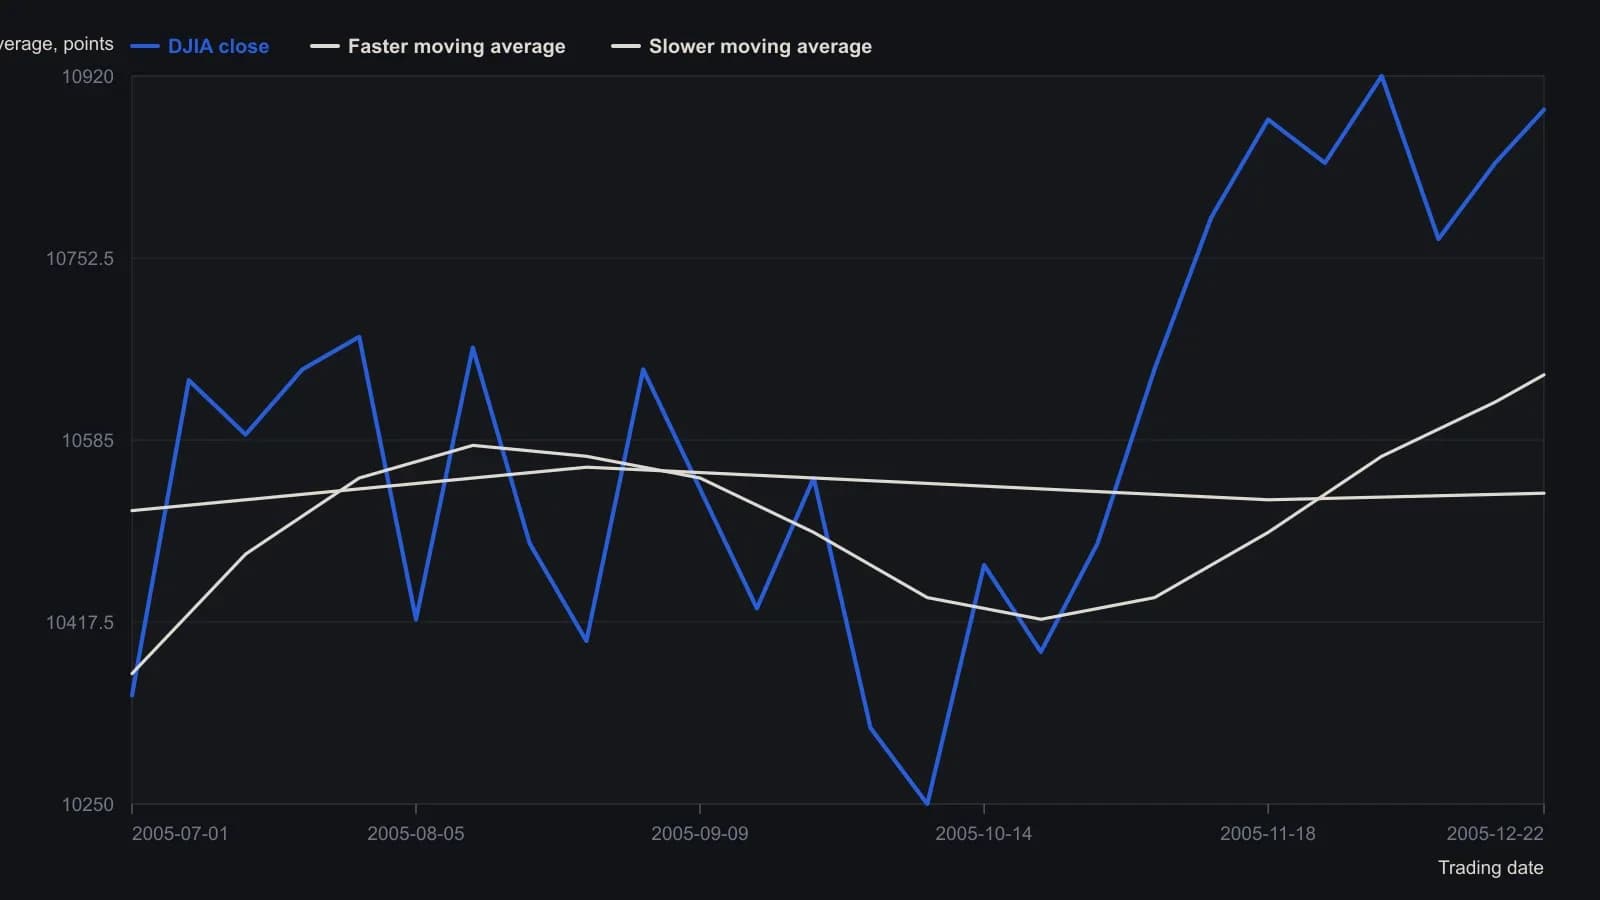
Daily closes are digitized from the candlestick pane to roughly the nearest 20–30 index points; the platform draws 108000 for a 10,800 Dow. Moving-average lookbacks are not labeled on the source chart, so the traces are carried only as the faster (blue) and slower (red) averages shown. Individual candle wicks are not reconstructed.
All readings on this track · 10 readings
- 1991GM support and resistance role reversal
- 2002Evaluating throwbacks and pullbacks after triangle breakouts
- 2002Spike-shaped double bottoms as a three-gate chart drill
- 2003Constructing bullish bottom patterns from structure and confirmation
- 2003Classifying breakout gaps by fill speed and throwback
- 2006The J-hook as two gates: rounded pullback and prior-high breakout
- 2006Evaluating double tops with a throwback clock
- 2007Check duration, breakout labels, and throwback timing before rectangle measuring rules
- 2016Confirmed double-bottom, later pennant, and throwback as separate checkpoints
- 2020Late double-bottom entries after throwbacks