2019issue C1230-33
Renko brick scale as a falsifiable trend hypothesis
A Renko chart prints a renko brick only after price travels a full chosen increment, so brick size is the scale of the idea. TradersWeek reads that scale as the hypothesis parameter: lock one increment, open only on a two-brick entry, and let a brick-through-entry exit or a pre-set dollar stop kill the idea.
- A renko brick prints only after price exceeds the prior brick by a full increment, so the chart records displacement rather than elapsed time and leaves price noise unprinted.
- Brick size may be a fixed dollar or point value or an average-true-range brick, and the printed increment can differ from the amount first entered.
- The case-study rule used a two-brick entry on an average-true-range chart and allowed exit by a fixed dollar amount below entry or by a brick-through-entry exit.
- A large brick size can consume a substantial part of a move before an exit brick appears, so the chosen scale is part of the exit test.
What a Renko chart prints
A Renko chart adds a new renko brick only after price exceeds the prior brick by a full chosen increment. Printing depends on displacement rather than elapsed time. Oscillations that never travel a full brick increment are price noise and do not print.
Direction is marked by brick color. Red marks downward increments. Clear, white, or green marks upward increments.
How brick size is set
Brick size is the dollar, point, or volatility increment that must be traveled before a new brick can print. The increment can be a fixed dollar or point value or an average-true-range value. A smaller increment produces more bricks.
Under an average-true-range setting, the brick that actually prints can differ from the dollar amount first entered. An intended $10 increment rendered as $8, and an intended $5 increment rendered as $29.05.
A range brick is a high-low construction. Range bricks tend to print more often than close-only bricks and are built so one brick close equals the next brick open.
The two-brick entry and the exits that kill it
The case-study rule opened after a second completed brick on an average-true-range chart. That two-brick entry was the opening condition.
Exit was allowed either by a fixed dollar amount below entry or by a later brick that passed the entry brick. The second path is a brick-through-entry exit.
The walk-throughs used year-length Renko charts with no indicators, trendlines, or volume. Brick sequences alone supplied the entry and exit conditions.
Scale as part of the exit test
In a side-by-side comparison of one equity, an average-true-range brick chart and a fixed $10 close-based brick chart showed roughly the same trend start and end and similar entry and exit locations.
A large brick increment can consume a substantial part of a move before an exit brick appears. The chosen scale is part of the exit test.
Twitter daily Renko, ATR $1 bricks
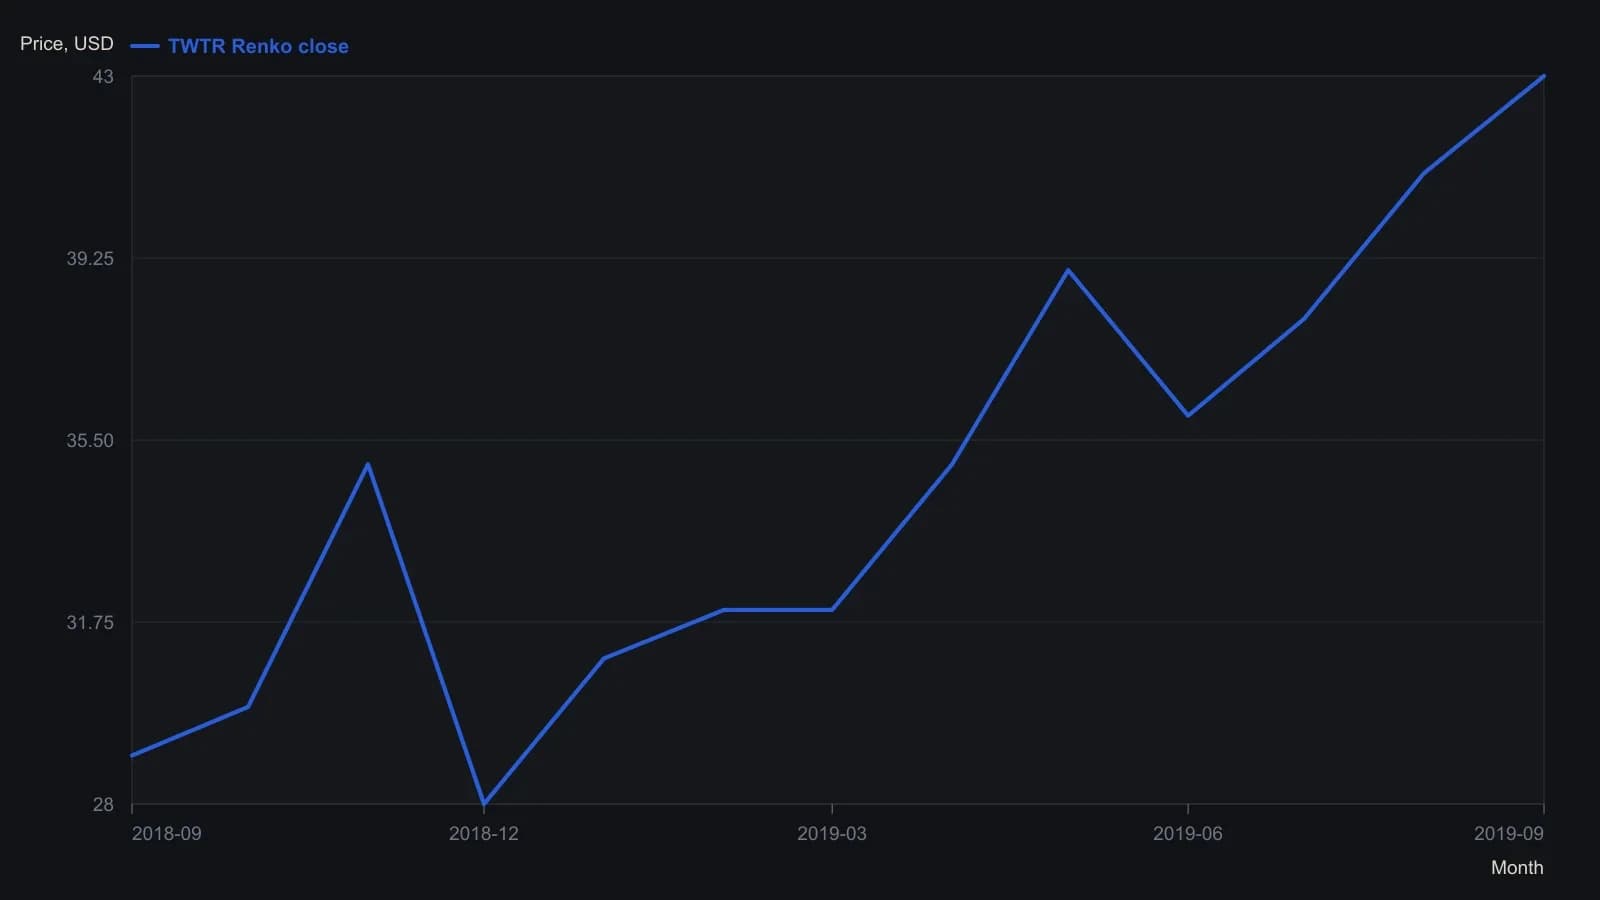
Brick size is ATR(5) close, printed as $1.00 on the chart header, not a fixed dollar brick. Digitized from the plotted bricks; y values are approximate to the nearest dollar.
All readings on this track · 14 readings
- 2007Renko brick construction and breakout rules
- 2014Modified Renko brick size from tick inputs
- 2014Renko brick increment and open construction
- 2014Modified renko construction with RSI bands and a trend filter
- 2014Construction checklist for a brick-chart crossover and same-session breakout
- 2015Optimizing virtual bar size as a trend filter
- 2015Constructing Renko energy bands so support and resistance arrive as pre-marked leans
- 2018Five-rule entries and exits with Elliott waves and Renko bricks
- 2018Modified Renko charts as a filter for fake breakouts
- 2018V-Trade reversal, retrace, and continuation rules
- 2018A finished impulse, a Fibonacci target, and a reversing Renko brick as one test
- 2019Brick sampling changes what a volatility envelope can show
- 2019A consecutive Renko brick count as a mechanical entry-exit procedure
- 2019Renko brick scale as a falsifiable trend hypothesis